Pizza Hut 2012 Annual Report Download - page 114
Download and view the complete annual report
Please find page 114 of the 2012 Pizza Hut annual report below. You can navigate through the pages in the report by either clicking on the pages listed below, or by using the keyword search tool below to find specific information within the annual report.-
 1
1 -
2
-
3
-
4
-
5
-
6
-
7
-
8
-
9
-
10
-
11
-
12
-
13
-
14
-
15
-
16
-
17
-
18
-
19
-
20
-
21
-
22
-
23
-
24
-
25
-
26
-
27
-
28
-
29
-
30
-
31
-
32
-
33
-
34
-
35
-
36
-
37
-
38
-
39
-
40
-
41
-
42
-
43
-
44
-
45
-
46
-
47
-
48
-
49
-
50
-
51
-
52
-
53
-
54
-
55
-
56
-
57
-
58
-
59
-
60
-
61
-
62
-
63
-
64
-
65
-
66
-
67
-
68
-
69
-
70
-
71
-
72
-
73
-
74
-
75
-
76
-
77
-
78
-
79
-
80
-
81
-
82
-
83
-
84
-
85
-
86
-
87
-
88
-
89
-
90
-
91
-
92
-
93
-
94
-
95
-
96
-
97
-
98
-
99
-
100
-
101
-
102
-
103
-
 104
104 -
 105
105 -
 106
106 -
 107
107 -
 108
108 -
 109
109 -
 110
110 -
 111
111 -
 112
112 -
 113
113 -
 114
114 -
 115
115 -
 116
116 -
 117
117 -
 118
118 -
 119
119 -
 120
120 -
 121
121 -
 122
122 -
 123
123 -
 124
124 -
125
-
126
-
127
-
128
-
129
-
130
-
131
-
132
-
133
-
134
-
135
-
136
-
137
-
138
-
139
-
140
-
141
-
142
-
143
-
144
-
145
-
146
-
147
-
148
-
149
-
150
-
151
-
152
-
153
-
154
-
155
-
156
-
157
-
158
-
159
-
160
-
161
-
162
-
163
-
164
-
165
-
166
-
167
-
168
-
169
-
170
-
171
-
172
 |
 |

YUM! BRANDS, INC.-2012 Form10-K 22
Form 10-K
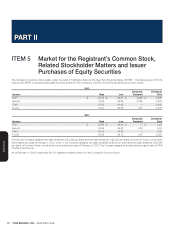
PART II
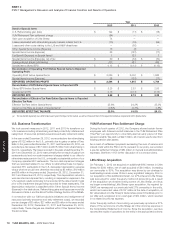
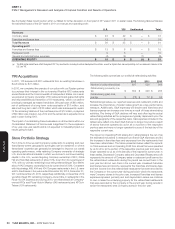
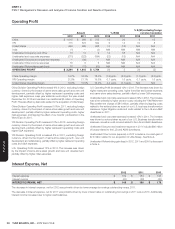
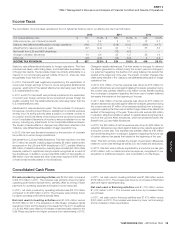
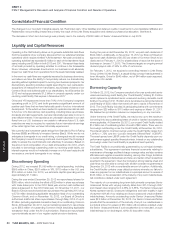
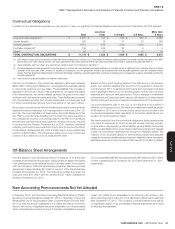
ITEM7Management’s Discussion and Analysis ofFinancial Condition and Results ofOperations
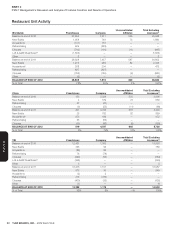
Restaurant Unit Activity
Worldwide Franchisees Company
Unconsolidated
Affi liates
Total Excluding
Licensees(a)
Balance at end of 2010 27,852 7,271 525 35,648
New Builds 1,058 749 73 1,880
Acquisitions (137) 137 — —
Refranchising 529 (529) — —
Closures (743) (191) (11) (945)
LJS & A&W Divestitures(b) (1,633) — — (1,633)
Other 2 — — 2
Balance at end of 2011 26,928 7,437 587 34,952
New Builds 1,274 989 82 2,345
Acquisitions(c) 268 204 — 472
Refranchising 897 (897) — —
Closures (756) (155) (9) (920)
Other (3) — — (3)
BALANCE AT END OF 2012 28,608 7,578 660 36,846
% of Total 78% 20% 2% 100%
China Franchisees Company
Unconsolidated
Affi liates
Total Excluding
Licensees(a)
Balance at end of 2010 153 3,228 525 3,906
New Builds 4 579 73 656
Refranchising 47 (47) — —
Closures (3) (55) (11) (69)
Balance at end of 2011 201 3,705 587 4,493
New Builds 25 782 82 889
Acquisitions(c) 273 199 — 472
Refranchising 53 (53) — —
Closures (33) (86) (9) (128)
BALANCE AT END OF 2012 519 4,547 660 5,726
% of Total 9% 79% 12% 100%
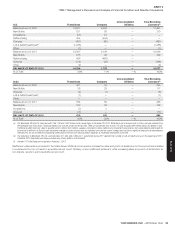
YRI Franchisees Company
Unconsolidated
Affi liates
Total Excluding
Licensees(a)
Balance at end of 2010 12,421 1,505 — 13,926
New Builds 735 53 — 788
Acquisitions (86) 86 — —
Refranchising 78 (78) — —
Closures (329) (55) — (384)
LJS & A&W Divestitures(b) (346) — — (346)
Other 3 — — 3
Balance at end of 2011 12,476 1,511 — 13,987
New Builds 873 76 — 949
Acquisitions (2) 2 — —
Refranchising 376 (376) — —
Closures (400) (35) — (435)
Other (1) — — (1)
BALANCE AT END OF 2012 13,322 1,178 — 14,500
% of Total 92% 8% —% 100%