Pizza Hut 2012 Annual Report Download - page 153
Download and view the complete annual report
Please find page 153 of the 2012 Pizza Hut annual report below. You can navigate through the pages in the report by either clicking on the pages listed below, or by using the keyword search tool below to find specific information within the annual report.-
 1
1 -
2
-
3
-
4
-
5
-
6
-
7
-
8
-
9
-
10
-
11
-
12
-
13
-
14
-
15
-
16
-
17
-
18
-
19
-
20
-
21
-
22
-
23
-
24
-
25
-
26
-
27
-
28
-
29
-
30
-
31
-
32
-
33
-
34
-
35
-
36
-
37
-
38
-
39
-
40
-
41
-
42
-
43
-
44
-
45
-
46
-
47
-
48
-
49
-
50
-
51
-
52
-
53
-
54
-
55
-
56
-
57
-
58
-
59
-
60
-
61
-
62
-
63
-
64
-
65
-
66
-
67
-
68
-
69
-
70
-
71
-
72
-
73
-
74
-
75
-
76
-
77
-
78
-
79
-
80
-
81
-
82
-
83
-
84
-
85
-
86
-
87
-
88
-
89
-
90
-
91
-
92
-
93
-
94
-
95
-
96
-
97
-
98
-
99
-
100
-
101
-
102
-
103
-
104
-
105
-
106
-
107
-
108
-
109
-
110
-
111
-
112
-
113
-
114
-
115
-
116
-
117
-
118
-
119
-
120
-
121
-
122
-
123
-
124
-
125
-
126
-
127
-
128
-
129
-
130
-
131
-
132
-
133
-
134
-
135
-
136
-
137
-
138
-
139
-
140
-
141
-
142
-
 143
143 -
 144
144 -
 145
145 -
 146
146 -
 147
147 -
 148
148 -
 149
149 -
 150
150 -
 151
151 -
 152
152 -
 153
153 -
 154
154 -
 155
155 -
 156
156 -
 157
157 -
 158
158 -
 159
159 -
 160
160 -
 161
161 -
 162
162 -
 163
163 -
164
-
165
-
166
-
167
-
168
-
169
-
170
-
171
-
172
 |
 |

YUM! BRANDS, INC.-2012 Form10-K 61
Form 10-K
PART II
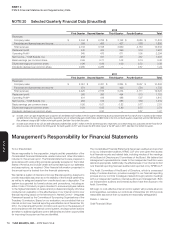
ITEM 8Financial Statements andSupplementaryData
participants to defer incentive compensation to purchase phantom shares
of our Common Stock and receive a 33% Company match on the amount
deferred.Deferrals receiving a match are similar to a RSU award in that
participants will generally forfeit both the match and incentive compensation
amounts deferred if they voluntarily separate from employment during a
vesting period that is two years from the date of deferral.We expense
the intrinsic value of the match and the incentive compensation over the
requisite service period which includes the vesting period.
Historically, the Company has repurchased shares on the open market in
excess of the amount necessary to satisfy award exercises and expects
to continue to do so in 2013.
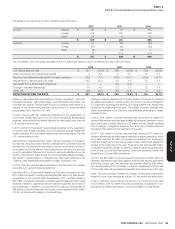
Award Valuation
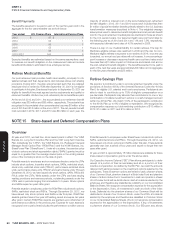
We estimated the fair value of each stock option and SAR award as of the date of grant using the Black-Scholes option-pricing model with the following
weighted-average assumptions:
2012 2011 2010
Risk-free interest rate 0.8% 2.0% 2.4%
Expected term (years) 6.0 5.9 6.0
Expected volatility 29.0% 28.2% 30.0%
Expected dividend yield 1.8% 2.0% 2.5%
We believe it is appropriate to group our stock option and SAR awards into
two homogeneous groups when estimating expected term.These groups
consist of grants made primarily to restaurant-level employees under the
RGM Plan, which cliff-vest after four years and expire ten years after grant,
and grants made to executives under our other stock award plans, which
typically have a graded vesting schedule of 25% per year over four years
and expire ten years after grant.We use a single weighted-average term
for our awards that have a graded vesting schedule.Based on analysis
of our historical exercise and post-vesting termination behavior, we have
determined that our restaurant-level employees and our executives
exercised the awards on average after 5 years and 6 years, respectively.
When determining expected volatility, we consider both historical volatility of
our stock as well as implied volatility associated with our traded options.The
expected dividend yield is based on the annual dividend yield at the time
of grant.
The fair values of RSU and PSU awards are based on the closing price
of our stock on the date of grant.
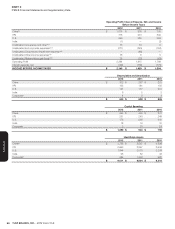
Award Activity
Stock Options and SARs
Shares (in thousands)
Weighted-Average
Exercise Price
Weighted- Average
Remaining
Contractual Term
Aggregate
Intrinsic Value
(in millions)
Outstanding at the beginning of the year 33,508 $ 31.28
Granted 3,780 64.86
Exercised (7,192) 23.75
Forfeited or expired (1,484) 40.91
OUTSTANDING AT THE END OF THE YEAR 28,612(A) $ 37.05 5.90 $ 793
EXERCISABLE AT THE END OF THE YEAR 16,813 $ 30.05 4.60 $ 583
(a) Outstanding awards include 4,671 options and 23,941 SARs with average exercise prices of $28.31 and $38.75, respectively.
The weighted-average grant-date fair value of stock options and SARs
granted during 2012, 2011 and 2010 was $15.00, $11.78 and $8.21,
respectively.The total intrinsic value of stock options and SARs exercised
during the years ended December29, 2012, December31, 2011 and
December25, 2010, was $319million, $226million and $259million,
respectively.
As of December29, 2012, there was $82million of unrecognized
compensation cost related to stock options and SARs, which will be
reduced by any forfeitures that occur, related to unvested awards that is
expected to be recognized over a remaining weighted-average period of
approximately 1.9 years.The total fair value at grant date of awards that
vested during 2012, 2011 and 2010 was $42million, $43million and
$47million, respectively.
RSUs and PSUs
As of December29, 2012, there was $8million of unrecognized compensation cost related to 0.7million unvested RSUs and PSUs.