Pizza Hut 2012 Annual Report Download - page 143
Download and view the complete annual report
Please find page 143 of the 2012 Pizza Hut annual report below. You can navigate through the pages in the report by either clicking on the pages listed below, or by using the keyword search tool below to find specific information within the annual report.-
 1
1 -
2
-
3
-
4
-
5
-
6
-
7
-
8
-
9
-
10
-
11
-
12
-
13
-
14
-
15
-
16
-
17
-
18
-
19
-
20
-
21
-
22
-
23
-
24
-
25
-
26
-
27
-
28
-
29
-
30
-
31
-
32
-
33
-
34
-
35
-
36
-
37
-
38
-
39
-
40
-
41
-
42
-
43
-
44
-
45
-
46
-
47
-
48
-
49
-
50
-
51
-
52
-
53
-
54
-
55
-
56
-
57
-
58
-
59
-
60
-
61
-
62
-
63
-
64
-
65
-
66
-
67
-
68
-
69
-
70
-
71
-
72
-
73
-
74
-
75
-
76
-
77
-
78
-
79
-
80
-
81
-
82
-
83
-
84
-
85
-
86
-
87
-
88
-
89
-
90
-
91
-
92
-
93
-
94
-
95
-
96
-
97
-
98
-
99
-
100
-
101
-
102
-
103
-
104
-
105
-
106
-
107
-
108
-
109
-
110
-
111
-
112
-
113
-
114
-
115
-
116
-
117
-
118
-
119
-
120
-
121
-
122
-
123
-
124
-
125
-
126
-
127
-
128
-
129
-
130
-
131
-
132
-
 133
133 -
 134
134 -
 135
135 -
 136
136 -
 137
137 -
 138
138 -
 139
139 -
 140
140 -
 141
141 -
 142
142 -
 143
143 -
 144
144 -
 145
145 -
 146
146 -
 147
147 -
 148
148 -
 149
149 -
 150
150 -
 151
151 -
 152
152 -
 153
153 -
154
-
155
-
156
-
157
-
158
-
159
-
160
-
161
-
162
-
163
-
164
-
165
-
166
-
167
-
168
-
169
-
170
-
171
-
172
 |
 |

YUM! BRANDS, INC.-2012 Form10-K 51
Form 10-K
PART II
ITEM 8Financial Statements andSupplementaryData
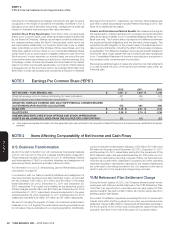
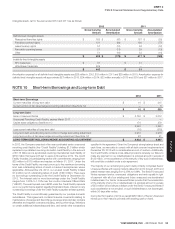
The following table summarizes the 2012 and 2011 activity related to reserves for remaining lease obligations for closed stores.
Beginning
Balance
Amounts
Used
New
Decisions
Estimate/
Decision
Changes CTA/Other Ending Balance
2012 Activity $ 34 (14) 3 3 1 $ 27
2011 Activity $ 28 (12) 17 2 (1) $ 34
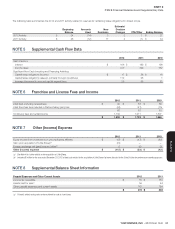
NOTE5 Supplemental Cash Flow Data
2012 2011 2010
Cash Paid For:
Interest $ 166 $ 199 $ 190
Income taxes 417 349 357
Signifi cant Non-Cash Investing and Financing Activities:
Capital lease obligations incurred $ 17 $ 58 $ 16
Capital lease obligations relieved, primarily through divestitures 112 65 1
Increase (decrease) in accrued capital expenditures 35 55 51
NOTE6 Franchise and License Fees and Income
2012 2011 2010
Initial fees, including renewal fees $ 92 $ 83 $ 68
Initial franchise fees included in Refranchising (gain) loss (24) (21) (15)
68 62 53
Continuing fees and rental income 1,732 1,671 1,507
$ 1,800 $ 1,733 $ 1,560
NOTE7 Other (Income) Expense
2012 2011 2010
Equity income from investments in unconsolidated affi liates $ (47) $ (47) $ (42)
Gain upon acquisition of Little Sheep(a) (74) — —
Foreign exchange net (gain) loss and other(b) 6 (6) (1)
Other (income) expense $ (115 ) $ (53 ) $ (43 )
(a) See Note4 for further details on the acquisition of Little Sheep.
(b) Includes $6million for the year ended December29, 2012 of deal costs related to the acquisition of Little Sheep that were allocated to the China Division for performance reporting purposes.
NOTE8 Supplemental Balance Sheet Information
Prepaid Expenses and Other Current Assets 2012 2011
Income tax receivable $ 55 $ 150
Assets held for sale(a) 56 24
Other prepaid expenses and current assets 161 164
$ 272 $ 338
(a) Primarily reflects restaurants we have offered for sale to franchisees.