Pizza Hut 2012 Annual Report Download - page 50
Download and view the complete annual report
Please find page 50 of the 2012 Pizza Hut annual report below. You can navigate through the pages in the report by either clicking on the pages listed below, or by using the keyword search tool below to find specific information within the annual report.-
 1
1 -
2
-
3
-
4
-
5
-
6
-
7
-
8
-
9
-
10
-
11
-
12
-
13
-
14
-
15
-
16
-
17
-
18
-
19
-
20
-
21
-
22
-
23
-
24
-
25
-
26
-
27
-
28
-
29
-
30
-
31
-
32
-
33
-
34
-
35
-
36
-
37
-
38
-
39
-
 40
40 -
 41
41 -
 42
42 -
 43
43 -
 44
44 -
 45
45 -
 46
46 -
 47
47 -
 48
48 -
 49
49 -
 50
50 -
 51
51 -
 52
52 -
 53
53 -
 54
54 -
 55
55 -
 56
56 -
 57
57 -
 58
58 -
 59
59 -
 60
60 -
61
-
62
-
63
-
64
-
65
-
66
-
67
-
68
-
69
-
70
-
71
-
72
-
73
-
74
-
75
-
76
-
77
-
78
-
79
-
80
-
81
-
82
-
83
-
84
-
85
-
86
-
87
-
88
-
89
-
90
-
91
-
92
-
93
-
94
-
95
-
96
-
97
-
98
-
99
-
100
-
101
-
102
-
103
-
104
-
105
-
106
-
107
-
108
-
109
-
110
-
111
-
112
-
113
-
114
-
115
-
116
-
117
-
118
-
119
-
120
-
121
-
122
-
123
-
124
-
125
-
126
-
127
-
128
-
129
-
130
-
131
-
132
-
133
-
134
-
135
-
136
-
137
-
138
-
139
-
140
-
141
-
142
-
143
-
144
-
145
-
146
-
147
-
148
-
149
-
150
-
151
-
152
-
153
-
154
-
155
-
156
-
157
-
158
-
159
-
160
-
161
-
162
-
163
-
164
-
165
-
166
-
167
-
168
-
169
-
170
-
171
-
172
 |
 |

YUM! BRANDS, INC.-2013Proxy Statement32
Proxy Statement
EXECUTIVE COMPENSATION
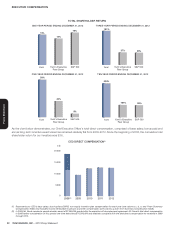
TOTAL SHAREHOLDER RETURN
Yum!
ONE-YEAR PERIOD ENDING DECEMBER 31, 2012
FIVE-YEAR PERIOD ENDING DECEMBER 31, 2012
Yum!’s Executive
Peer Group
S&P 500
15%
13%
16%
Yum!
THREE-YEAR PERIOD ENDING DECEMBER 31, 2012
Yum!’s Executive
Peer Group
S&P 500
101%
37% 36%
Yum! Yum!’s Executive
Peer Group
S&P 500
93%
40%
9%
Yum!
TEN-YEAR PERIOD ENDING DECEMBER 31, 2012
Yum!’s Executive
Peer Group
S&P 500
534%
167% 99%
As the chart below demonstrates, our Chief Executive Offi cer’s total direct compensation, comprised of base salary, bonus paid and
annual long-term incentive award value has remained relatively fl at from 2009-2012. Since the beginning of 2008, the cumulative total
shareholder return for our investors was 93%.
CEO DIRECT COMPENSATION(1)
0
5 000
10 000
15 000
20 000
in $
2008(2) 2009 2010 2011 2012
(1) Represents our CEO’s base salary, stock options/SARS, non-equity incentive plan compensation for each year (see c olumns c , d , e , and f from S ummary
C ompensation T able) and excludes income attributable to pension and other compensation (see columns g and h from S ummary C ompensation T able).
(2) In 2008, Mr.Novak received a special retention award of $7,000,000 granted after the expiration of his employment agreement. Mr.Novak’s total direct compensation
in 2008 before consideration of this special one-time award was $11,500,000 and relatively consistent with the total direct compensation he received in 2009
through 2012.