Pizza Hut 2012 Annual Report Download - page 140
Download and view the complete annual report
Please find page 140 of the 2012 Pizza Hut annual report below. You can navigate through the pages in the report by either clicking on the pages listed below, or by using the keyword search tool below to find specific information within the annual report.-
 1
1 -
2
-
3
-
4
-
5
-
6
-
7
-
8
-
9
-
10
-
11
-
12
-
13
-
14
-
15
-
16
-
17
-
18
-
19
-
20
-
21
-
22
-
23
-
24
-
25
-
26
-
27
-
28
-
29
-
30
-
31
-
32
-
33
-
34
-
35
-
36
-
37
-
38
-
39
-
40
-
41
-
42
-
43
-
44
-
45
-
46
-
47
-
48
-
49
-
50
-
51
-
52
-
53
-
54
-
55
-
56
-
57
-
58
-
59
-
60
-
61
-
62
-
63
-
64
-
65
-
66
-
67
-
68
-
69
-
70
-
71
-
72
-
73
-
74
-
75
-
76
-
77
-
78
-
79
-
80
-
81
-
82
-
83
-
84
-
85
-
86
-
87
-
88
-
89
-
90
-
91
-
92
-
93
-
94
-
95
-
96
-
97
-
98
-
99
-
100
-
101
-
102
-
103
-
104
-
105
-
106
-
107
-
108
-
109
-
110
-
111
-
112
-
113
-
114
-
115
-
116
-
117
-
118
-
119
-
120
-
121
-
122
-
123
-
124
-
125
-
126
-
127
-
128
-
129
-
 130
130 -
 131
131 -
 132
132 -
 133
133 -
 134
134 -
 135
135 -
 136
136 -
 137
137 -
 138
138 -
 139
139 -
 140
140 -
 141
141 -
 142
142 -
 143
143 -
 144
144 -
 145
145 -
 146
146 -
 147
147 -
 148
148 -
 149
149 -
 150
150 -
151
-
152
-
153
-
154
-
155
-
156
-
157
-
158
-
159
-
160
-
161
-
162
-
163
-
164
-
165
-
166
-
167
-
168
-
169
-
170
-
171
-
172
 |
 |

YUM! BRANDS, INC.-2012 Form10-K 48
Form 10-K
PART II
ITEM 8Financial Statements andSupplementaryData
instruments not designated as hedging instruments, the gain or loss is
recognized in the results of operations immediately.See Note12 for a
discussion of our use of derivative instruments, management of credit risk
inherent in derivative instruments and fair value information.
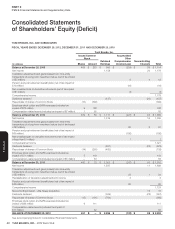
Common Stock Share Repurchases.From time to time, we repurchase
shares of our Common Stock under share repurchase programs authorized
by our Board of Directors.Shares repurchased constitute authorized,
but unissued shares under the North Carolina laws under which we
are incorporated.Additionally, our Common Stock has no par or stated
value.Accordingly, we record the full value of share repurchases, upon the
trade date, against Common Stock on our Consolidated Balance Sheet
except when to do so would result in a negative balance in such Common
Stock account.In such instances, on a period basis, we record the cost
of any further share repurchases as a reduction in retained earnings.Due
to the large number of share repurchases and the increase in the market
value of our stock over the past several years, our Common Stock balance
is frequently zero at the end of any period.Accordingly, $794million and
$483million in share repurchases were recorded as a reduction in Retained
Earnings in 2012 and 2011, respectively. Our Common Stock balance was
such that no share repurchases impacted Retained Earnings in 2010.See
Note16 for additional information.
Pension and Post-retirement Medical Benefi ts.We measure and recognize
the overfunded or underfunded status of our pension and post-retirement
plans as an asset or liability in our Consolidated Balance Sheet as of our
fi scal year end.The funded status represents the difference between
the projected benefi t obligations and the fair value of plan assets.The
projected benefi t obligation is the present value of benefi ts earned to
date by plan participants, including the effect of future salary increases,
as applicable.The difference between the projected benefi t obligations
and the fair value of plan assets that has not previously been recognized
in our Consolidated Statement of Income is recorded as a component of
Accumulated other comprehensive income (loss).
We recognize settlement gains or losses only when the cost of all settlements
in a year exceeds the sum of the service and interest costs within an
individual plan.
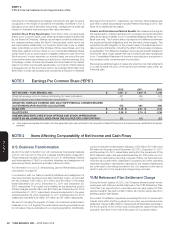
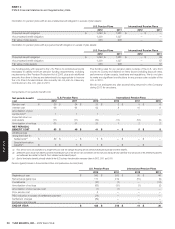
NOTE3 Earnings Per Common Share (“EPS”)
2012 2011 2010
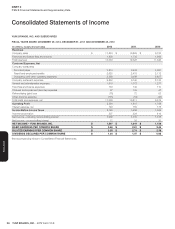
NET INCOME – YUM! BRANDS, INC. $ 1,597 $ 1,319 $ 1,158
Weighted-average common shares outstanding (for basic calculation) 461 469 474
Effect of dilutive share-based employee compensation 12 12 12
WEIGHTED-AVERAGE COMMON AND DILUTIVE POTENTIAL COMMON SHARES
OUTSTANDING (FOR DILUTED CALCULATION) 473 481 486
BASIC EPS $ 3.46 $ 2.81 $ 2.44
DILUTED EPS $ 3.38 $ 2.74 $ 2.38
UNEXERCISED EMPLOYEE STOCK OPTIONS AND STOCK APPRECIATION
RIGHTS (IN MILLIONS) EXCLUDED FROM THE DILUTED EPS COMPUTATION(a) 3.1 4.2 2.2
(a) These unexercised employee stock options and stock appreciation rights were not included in the computation of diluted EPS because to do so would have been antidilutive for the periods
presented.
NOTE4 Items Affecting Comparability of Net Income and Cash Flows
U.S. Business Transformation
As part of our plan to transform our U.S. business we took several measures
in 2012, 2011 and 2010 (“the U.S. business transformation measures”).
These measures included: continuation of our U.S. refranchising; General
and Administrative (“G&A”) productivity initiatives and realignment of
resources (primarily severance and early retirement costs).
For information on our U.S. refranchising, see the Refranchising (Gain)
Loss section on page 50 .
In connection with our G&A productivity initiatives and realignment of
resources (primarily severance and early retirement costs), we recorded
pre-tax charges of $5million, $21million and $9million in the years
ended December29, 2012, December31, 2011 and December25,
2010, respectively.The unpaid current liability for the severance portion
of these charges was $5million and $18million as of December29, 2012
and December31, 2011, respectively.Severance payments in the years
ended December29, 2012, December31, 2011 and December25, 2010
totaled approximately $14million, $4million and $7million respectively.
We are not including the impacts of these U.S. business transformation
measures in our U.S. segment for performance reporting purposes as we
do not believe they are indicative of our ongoing operations.Additionally,
we did not include the depreciation reduction of $3million, $10million and
$9million for the years ended December29, 2012, December31, 2011
and December25, 2010, respectively, arising from the impairment of the
KFCs offered for sale in the year ended December25, 2010 within our U.S.
segment for performance reporting purposes.Rather, we recorded such
reduction as a credit within unallocated Occupancy and other operating
expenses resulting in depreciation expense for the impaired restaurants
we continued to own being recorded in the U.S. segment at the rate at
which it was prior to the impairment charge being recorded.
YUM Retirement Plan Settlement Charge
During the fourth quarter of 2012, the Company allowed certain former
employees with deferred vested balances in the YUM Retirement Plan
(“the Plan”) an opportunity to voluntarily elect an early payout of their
pension benefi ts. We paid out $227million, all of which was funded from
existing pension plan assets.
As a result of settlement payments exceeding the sum of service and
interest costs within the Plan, pursuant to our policy, we recorded a pre-tax
settlement charge of $84million in General and administrative expenses in
the fourth quarter of 2012 which was not allocated for segment reporting
purposes. See Note14 for further discussion of our pension plans.