Pizza Hut 2012 Annual Report Download - page 146
Download and view the complete annual report
Please find page 146 of the 2012 Pizza Hut annual report below. You can navigate through the pages in the report by either clicking on the pages listed below, or by using the keyword search tool below to find specific information within the annual report.-
 1
1 -
2
-
3
-
4
-
5
-
6
-
7
-
8
-
9
-
10
-
11
-
12
-
13
-
14
-
15
-
16
-
17
-
18
-
19
-
20
-
21
-
22
-
23
-
24
-
25
-
26
-
27
-
28
-
29
-
30
-
31
-
32
-
33
-
34
-
35
-
36
-
37
-
38
-
39
-
40
-
41
-
42
-
43
-
44
-
45
-
46
-
47
-
48
-
49
-
50
-
51
-
52
-
53
-
54
-
55
-
56
-
57
-
58
-
59
-
60
-
61
-
62
-
63
-
64
-
65
-
66
-
67
-
68
-
69
-
70
-
71
-
72
-
73
-
74
-
75
-
76
-
77
-
78
-
79
-
80
-
81
-
82
-
83
-
84
-
85
-
86
-
87
-
88
-
89
-
90
-
91
-
92
-
93
-
94
-
95
-
96
-
97
-
98
-
99
-
100
-
101
-
102
-
103
-
104
-
105
-
106
-
107
-
108
-
109
-
110
-
111
-
112
-
113
-
114
-
115
-
116
-
117
-
118
-
119
-
120
-
121
-
122
-
123
-
124
-
125
-
126
-
127
-
128
-
129
-
130
-
131
-
132
-
133
-
134
-
135
-
 136
136 -
 137
137 -
 138
138 -
 139
139 -
 140
140 -
 141
141 -
 142
142 -
 143
143 -
 144
144 -
 145
145 -
 146
146 -
 147
147 -
 148
148 -
 149
149 -
 150
150 -
 151
151 -
 152
152 -
 153
153 -
 154
154 -
 155
155 -
 156
156 -
157
-
158
-
159
-
160
-
161
-
162
-
163
-
164
-
165
-
166
-
167
-
168
-
169
-
170
-
171
-
172
 |
 |
YUM! BRANDS, INC.-2012 Form10-K 54
Form 10-K
PART II
ITEM 8Financial Statements andSupplementaryData
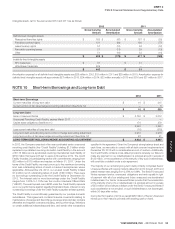
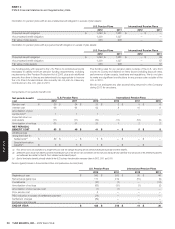
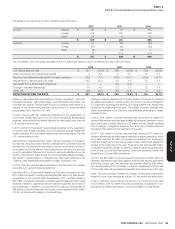
The following table summarizes all Senior Unsecured Notes issued that remain outstanding at December29, 2012:
Issuance Date(a) Maturity Date
Principal Amount
(in millions)
Interest Rate
Stated Effective(b)
April2006 April2016 $ 300 6.25% 6.03%
October2007 March2018 $ 600 6.25% 6.38%
October2007 November2037 $ 600 6.88% 7.29%
August2009 September2015 $ 250 4.25% 4.44%
August2009 September2019 $ 250 5.30% 5.59%
August2010 November2020 $ 350 3.88% 4.01%
August2011 November2021 $ 350 3.75% 3.88%
September2011 September2014 $ 56 2.38% 2.89%
(a) Interest payments commenced approximately six months after issuance date and are payable semi-annually thereafter.
(b) Includes the effects of the amortization of any (1) premium or discount; (2) debt issuance costs; and (3) gain or loss upon settlement of related treasury locks and forward-starting interest
rate swaps utilized to hedge the interest rate risk prior to the debt issuance.Excludes the effect of any swaps that remain outstanding as described in Note12.
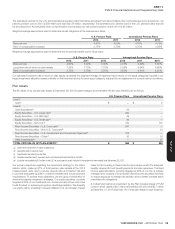
The annual maturities of short-term borrowings and long-term debt as of December29, 2012, excluding capital lease obligations of $170million and fair value
hedge accounting adjustments of $22million, are as follows:
Year ended:
2013 $—
2014 56
2015 250
2016 300
2017 —
Thereafter 2,150
TOTAL $ 2,756
Interest expense on short-term borrowings and long-term debt was $169million, $184million and $195million in 2012, 2011 and 2010, respectively.
NOTE11 Leases
At December29, 2012 we operated nearly 7,600 restaurants, leasing the
underlying land and/or building in nearly 6,700 of those restaurants with
the vast majority of our commitments expiring within 20 years from the
inception of the lease.Our longest lease expires in 2151.We also lease
offi ce space for headquarters and support functions, as well as certain
offi ce and restaurant equipment.We do not consider any of these individual
leases material to our operations.Most leases require us to pay related
executory costs, which include property taxes, maintenance and insurance.
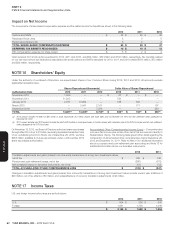
Future minimum commitments and amounts to be received as lessor or sublessor under non-cancelable leases are set forth below:
Commitments Lease Receivables
Capital Operating Direct Financing Operating
2013 $ 18 $ 678 $ 2 $ 57
2014 18 634 2 52
2015 19 592 2 49
2016 19 556 2 45
2017 17 500 2 41
Thereafter 189 2,714 12 185
$ 280 $ 5,674 $ 22 $ 429
At December29, 2012 and December31, 2011, the present value of minimum payments under capital leases was $170million and $279million,
respectively.At December29, 2012, unearned income associated with direct fi nancing lease receivables was $12million.
The details of rental expense and income are set forth below:
2012 2011 2010
RENTAL EXPENSE
Minimum $ 721 $ 625 $ 565
Contingent 290 233 158
$ 1,011 $ 858 $ 723
RENTAL INCOME $ 77 $ 66 $ 44