Pizza Hut 2012 Annual Report Download - page 3
Download and view the complete annual report
Please find page 3 of the 2012 Pizza Hut annual report below. You can navigate through the pages in the report by either clicking on the pages listed below, or by using the keyword search tool below to find specific information within the annual report.-
 1
1 -
 2
2 -
 3
3 -
 4
4 -
 5
5 -
 6
6 -
 7
7 -
 8
8 -
 9
9 -
 10
10 -
 11
11 -
 12
12 -
 13
13 -
 14
14 -
15
-
16
-
17
-
18
-
19
-
20
-
21
-
22
-
23
-
24
-
25
-
26
-
27
-
28
-
29
-
30
-
31
-
32
-
33
-
34
-
35
-
36
-
37
-
38
-
39
-
40
-
41
-
42
-
43
-
44
-
45
-
46
-
47
-
48
-
49
-
50
-
51
-
52
-
53
-
54
-
55
-
56
-
57
-
58
-
59
-
60
-
61
-
62
-
63
-
64
-
65
-
66
-
67
-
68
-
69
-
70
-
71
-
72
-
73
-
74
-
75
-
76
-
77
-
78
-
79
-
80
-
81
-
82
-
83
-
84
-
85
-
86
-
87
-
88
-
89
-
90
-
91
-
92
-
93
-
94
-
95
-
96
-
97
-
98
-
99
-
100
-
101
-
102
-
103
-
104
-
105
-
106
-
107
-
108
-
109
-
110
-
111
-
112
-
113
-
114
-
115
-
116
-
117
-
118
-
119
-
120
-
121
-
122
-
123
-
124
-
125
-
126
-
127
-
128
-
129
-
130
-
131
-
132
-
133
-
134
-
135
-
136
-
137
-
138
-
139
-
140
-
141
-
142
-
143
-
144
-
145
-
146
-
147
-
148
-
149
-
150
-
151
-
152
-
153
-
154
-
155
-
156
-
157
-
158
-
159
-
160
-
161
-
162
-
163
-
164
-
165
-
166
-
167
-
168
-
169
-
170
-
171
-
172
 |
 |

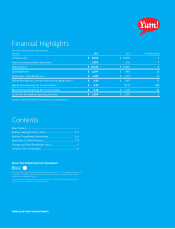
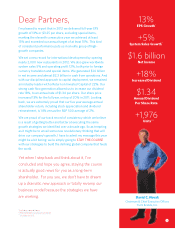
13%
EPS Growth*
+5%
System Sales Growth**
$1.6 billion
Net Income
+18%
Increased Dividend
$1.34
Annual Dividend
Per Share Rate
+1,976
Units***
David C. Novak
Chairman & Chief Executive Officer,
Yum! Brands, Inc.
*Excluding special items
**Prior to foreign currency translation
***Outside the U.S.
Dear Partners,
I’m pleased to report that in 2012 we delivered full-year EPS
growth of 13% or $3.25 per share, excluding special items,
marking the eleventh consecutive year we achieved at least
13% and exceeded our annual target of at least 10%. This kind
of consistent performance puts us in an elite group of high-
growth companies.
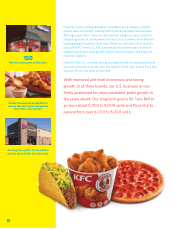
We set a new record for international development by opening
nearly 2,000 new restaurants in 2012. We also grew worldwide
system sales 5% and operating profit 12%, both prior to foreign
currency translation and special items. We generated $1.6 billion
in net income and almost $2.3 billion in cash from operations. And
with our disciplined approach to capital deployment, we remained
an industry leader with a Return on Invested Capital of 22%. Our
strong cash flow generation allowed us to increase our dividend
rate 18%, to an annual rate of $1.34 per share. Our share price
increased 13% for the full year, on top of 20% in 2011. Looking
back, we are extremely proud that our five year average annual
shareholder return, including stock appreciation and dividend
reinvestment, is 14% versus the S&P 500 average of 2%.
We are proud of our track record of consistency which we believe
is a result of getting better and better at executing the same
growth strategies we identified over a decade ago. So as tempting
as it might be to unveil some new revolutionary thinking that will
drive our company’s growth, I have to admit my message this year
might be a bit boring: we’re simply going to STAY THE COURSE
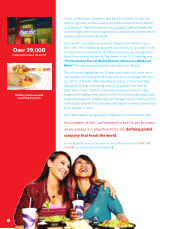
with our strategies to build the defining global company that feeds
the world.
Yet when I step back and think about it, I’ve
concluded and hope you agree, staying the course
is actually good news for you as a long-term
shareholder. For you see, we don’t have to dream
up a dramatic new approach or totally revamp our
business model because the strategies we have
are working.
1