Pizza Hut 2012 Annual Report Download - page 142
Download and view the complete annual report
Please find page 142 of the 2012 Pizza Hut annual report below. You can navigate through the pages in the report by either clicking on the pages listed below, or by using the keyword search tool below to find specific information within the annual report.-
 1
1 -
2
-
3
-
4
-
5
-
6
-
7
-
8
-
9
-
10
-
11
-
12
-
13
-
14
-
15
-
16
-
17
-
18
-
19
-
20
-
21
-
22
-
23
-
24
-
25
-
26
-
27
-
28
-
29
-
30
-
31
-
32
-
33
-
34
-
35
-
36
-
37
-
38
-
39
-
40
-
41
-
42
-
43
-
44
-
45
-
46
-
47
-
48
-
49
-
50
-
51
-
52
-
53
-
54
-
55
-
56
-
57
-
58
-
59
-
60
-
61
-
62
-
63
-
64
-
65
-
66
-
67
-
68
-
69
-
70
-
71
-
72
-
73
-
74
-
75
-
76
-
77
-
78
-
79
-
80
-
81
-
82
-
83
-
84
-
85
-
86
-
87
-
88
-
89
-
90
-
91
-
92
-
93
-
94
-
95
-
96
-
97
-
98
-
99
-
100
-
101
-
102
-
103
-
104
-
105
-
106
-
107
-
108
-
109
-
110
-
111
-
112
-
113
-
114
-
115
-
116
-
117
-
118
-
119
-
120
-
121
-
122
-
123
-
124
-
125
-
126
-
127
-
128
-
129
-
130
-
131
-
 132
132 -
 133
133 -
 134
134 -
 135
135 -
 136
136 -
 137
137 -
 138
138 -
 139
139 -
 140
140 -
 141
141 -
 142
142 -
 143
143 -
 144
144 -
 145
145 -
 146
146 -
 147
147 -
 148
148 -
 149
149 -
 150
150 -
 151
151 -
 152
152 -
153
-
154
-
155
-
156
-
157
-
158
-
159
-
160
-
161
-
162
-
163
-
164
-
165
-
166
-
167
-
168
-
169
-
170
-
171
-
172
 |
 |

YUM! BRANDS, INC.-2012 Form10-K 50
Form 10-K
PART II
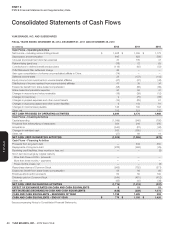
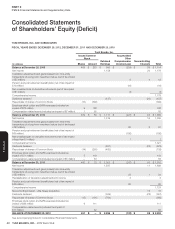
ITEM 8Financial Statements andSupplementaryData
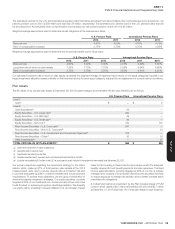
Refranchising (Gain) Loss
The Refranchising (gain) loss by reportable segment is presented below. We do not allocate such gains and losses to our segments for performance
reporting purposes.
Refranchising (gain) loss
2012 2011 2010
China $ (17) $ (14) $ (8)
YRI
(a)(b)(c) 61 69 53
U.S.
(d) (122) 17 18
India — — —
WORLDWIDE $ (78) $ 72 $ 63
(a) During the fourth quarter of 2012, we refranchised our remaining 331 Company-owned Pizza Hut dine-in restaurants in the United Kingdom. The newly signed franchise agreement for these
stores allows the franchisee to pay continuing franchise fees in the initial years of the agreement at a reduced rate. We agreed to allow the franchisee to pay these reduced fees in part as
consideration for their assumption of lease liabilities related to underperforming stores that we anticipate they will close that were part of the refranchising. We recognize the estimated value of
terms in franchise agreements entered into concurrently with a refranchising transaction that are not consistent with market terms as part of the upfront refranchising gain (loss). Accordingly,
upon the closing of this refranchising we recognized a loss of $53million representing the estimated value of these reduced continuing fees. The associated deferred credit is recorded within
Other liabilities and deferred credits in our Consolidated Balance Sheet as of December29, 2012 and will be amortized into YRI’s Franchise and license fees and income over the next 4 years,
including $16million in 2013. This upfront loss largely contributed to a $70million Refranchising loss we recognized during 2012 as a result of this refranchising. Also included in that loss
was the write-off of $14million in goodwill allocated to the Pizza Hut UK reporting unit. The remaining carrying value of goodwill allocated to our Pizza Hut UK business of $87million, after the
aforementioned write-off, was determined not to be impaired as the fair value of the Pizza Hut UK reporting unit exceeded its carrying amount. An income tax benefit of $9million was recorded
in 2012 as a result of this $70million refranchising loss.
During 2011, we recorded a $76million charge in Refranchising gain (loss) as a result of our decision to refranchise or close all of our remaining company-owned Pizza Hut UK dine-in restaurants,
primarily to write down these restaurants’ long-lived assets to their then estimated fair value. Impairment charges of Pizza Hut UK long-lived assets incurred as a result of this decision, including
the charge mentioned in the previous sentence, reduced depreciation expense versus what would have otherwise been recorded by $13million and $3million for the years ended December29,
2012 and December31, 2011, respectively.
(b) In the year ended December25, 2010 we recorded a $52million loss on the refranchising of our Mexico equity market as we sold all of our Company-owned restaurants, comprised of 222
KFCs and 123 Pizza Huts, to an existing Latin American franchise partner.The buyer is serving as the master franchisee for Mexico which had 102 KFC and 53 Pizza Hut franchise restaurants
at the time of the transaction.The write-off of goodwill included in this loss was minimal as our Mexico reporting unit included an insignificant amount of goodwill.This loss did not result in any
related income tax benefit.
(c) During the year ended December25, 2010 we refranchised all of our remaining company restaurants in Taiwan, which consisted of 124 KFCs.We included in our December25, 2010 financial
statements a write-off of $7million of goodwill in determining the loss on refranchising of Taiwan.This loss did not result in a related income tax benefit.The remaining carrying value of goodwill
related to our Taiwan business of $30million, after the aforementioned write-off, was determined not to be impaired as the fair value of the Taiwan reporting unit exceeded its carrying amount.
(d) U.S. Refranchising (gain) loss in the year ended December29, 2012 is primarily due to gains on sales of Taco Bells. U.S. Refranchising (gain) loss in the years ended December31, 2011 and
December25, 2010 is primarily due to losses on sales of and offers to refranchise KFCs in the U.S.The non-cash impairment charges that were recorded related to our offers to refranchise
these company-operated KFC restaurants in the U.S. decreased depreciation expense versus what would have otherwise been recorded by $3million, $10million and $9million in the years
ended December29, 2012, December31, 2011 and December25, 2010, respectively. These depreciation reductions were not allocated to the U.S. segment resulting in depreciation expense
in the U.S. segment results continuing to be recorded at the rate at which it was prior to the impairment charges being recorded for these restaurants.
See Note2 for our policy for writing off goodwill in a refranchising transaction.
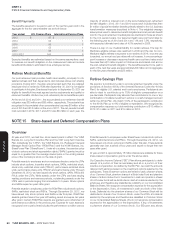
Store Closure and Impairment Activity
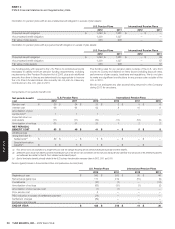
Store closure (income) costs and Store impairment charges by reportable segment are presented below. These tables exclude $80million of net losses recorded
in 2011 related to the LJS and A&W divestitures. This amount was not allocated to any segment for performance reporting purposes:
2012
China YRI U.S. India Worldwide
Store closure (income) costs(a) $ (4) $ 12$ —$ —$ 8
Store impairment charges 13 7 9 — 29
CLOSURE AND IMPAIRMENT (INCOME) EXPENSES $ 9 $ 19 $ 9 $ — $ 37
2011
China YRI U.S. India Worldwide
Store closure (income) costs(a) $(1)$4$4$—$7
Store impairment charges 13 18 17 — 48
CLOSURE AND IMPAIRMENT (INCOME) EXPENSES $ 12 $ 22 $ 21 $ — $ 55
2010
China YRI U.S. India Worldwide
Store closure (income) costs(a) $—$2$3$—$5
Store impairment charges 16 12 14 — 42
CLOSURE AND IMPAIRMENT (INCOME) EXPENSES $ 16 $ 14 $ 17 $ — $ 47
(a) Store closure (income) costs include the net gain or loss on sales of real estate on which we formerly operated a Company restaurant that was closed, lease reserves established when we
cease using a property under an operating lease and subsequent adjustments to those reserves and other facility-related expenses from previously closed stores.