Pizza Hut 2012 Annual Report Download - page 118
Download and view the complete annual report
Please find page 118 of the 2012 Pizza Hut annual report below. You can navigate through the pages in the report by either clicking on the pages listed below, or by using the keyword search tool below to find specific information within the annual report.-
 1
1 -
2
-
3
-
4
-
5
-
6
-
7
-
8
-
9
-
10
-
11
-
12
-
13
-
14
-
15
-
16
-
17
-
18
-
19
-
20
-
21
-
22
-
23
-
24
-
25
-
26
-
27
-
28
-
29
-
30
-
31
-
32
-
33
-
34
-
35
-
36
-
37
-
38
-
39
-
40
-
41
-
42
-
43
-
44
-
45
-
46
-
47
-
48
-
49
-
50
-
51
-
52
-
53
-
54
-
55
-
56
-
57
-
58
-
59
-
60
-
61
-
62
-
63
-
64
-
65
-
66
-
67
-
68
-
69
-
70
-
71
-
72
-
73
-
74
-
75
-
76
-
77
-
78
-
79
-
80
-
81
-
82
-
83
-
84
-
85
-
86
-
87
-
88
-
89
-
90
-
91
-
92
-
93
-
94
-
95
-
96
-
97
-
98
-
99
-
100
-
101
-
102
-
103
-
104
-
105
-
106
-
107
-
 108
108 -
 109
109 -
 110
110 -
 111
111 -
 112
112 -
 113
113 -
 114
114 -
 115
115 -
 116
116 -
 117
117 -
 118
118 -
 119
119 -
 120
120 -
 121
121 -
 122
122 -
 123
123 -
 124
124 -
 125
125 -
 126
126 -
 127
127 -
 128
128 -
129
-
130
-
131
-
132
-
133
-
134
-
135
-
136
-
137
-
138
-
139
-
140
-
141
-
142
-
143
-
144
-
145
-
146
-
147
-
148
-
149
-
150
-
151
-
152
-
153
-
154
-
155
-
156
-
157
-
158
-
159
-
160
-
161
-
162
-
163
-
164
-
165
-
166
-
167
-
168
-
169
-
170
-
171
-
172
 |
 |

YUM! BRANDS, INC.-2012 Form10-K 26
Form 10-K
PART II
ITEM7Management’s Discussion and Analysis ofFinancial Condition and Results ofOperations
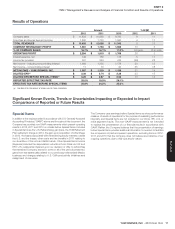
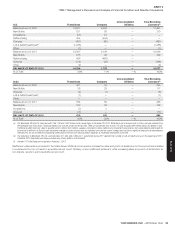
Income/(Expense)
2011 vs. 2010
2010
Store Portfolio
Actions Other
53rd Week in
2011 2011
Company sales $ 3,355 $ (322) $ (76) $ 43 $ 3,000
Cost of sales (976) 95 (23) (13) (917)
Cost of labor (994) 101 (7) (12) (912)
Occupancy and other (908) 95 13 (9) (809)
RESTAURANT PROFIT $ 477 $ (31) $ (93) $ 9 $ 362
Restaurant margin 14.2% 12.1%
In 2012, the decrease in U.S. Company sales and Restaurant
profi t associated with store portfolio actions was primarily driven by
refranchising.Signifi cant other factors impacting Company sales and/
or Restaurant profi t were same-store sales growth of 5%, including the
positive impact of less discounting, combined with the positive impact
of sales mix shifts as well as supply chain effi ciencies, partially offset by
higher restaurant-level incentive compensation costs.
In 2011, the decrease in U.S. Company sales and Restaurant
profi t associated with store portfolio actions was primarily driven by
refranchising.Signifi cant other factors impacting Company sales and/or
Restaurant profi t were commodity infl ation of $55million, or 6%, Company
same-store sales declines of 3%, including a negative impact from sales
mix shift, and higher self-insurance costs.
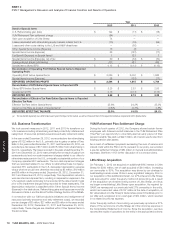
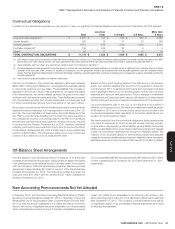
Franchise and L icense F ees and I ncome
Amount % Increase (Decrease)
% Increase (Decrease)
excluding foreign
currency translation
% Increase (Decrease)
excluding foreign
currency translation
and 53rd week
2012 2011 2010 2012 2011 2012 2011 2012 2011
China $ 101 $ 79 $ 54 29 45 25 38 25 38
YRI 879 851 729 3 17 7 12 8 11
U.S. 802 786 765 2 3 N/A N/A 4 1
India 18 17 12 6 39 18 39 18 39
WORLDWIDE $ 1,800 $ 1,733 $ 1,560 4116877
China Franchise and license fees and income increased 25% and 38%
in 2012 and 2011, respectively, excluding the impact of foreign currency
translation. The increases were driven by refranchising, new unit development
and positive franchise same-store sales.
YRI Franchise and license fees and income increased 8% in 2012, excluding
the impacts of foreign currency translation and the 53rd week in 2011.
The increase was driven by new unit development and positive franchise
same-store sales. YRI Franchise and license fees and income increased
11% in 2011, excluding the impacts of foreign currency translation and the
53
rd
week. The increase was driven by new unit development, refranchising
and positive franchise same-store sales.
U.S. Franchise and license fees and income increased 4% in 2012, excluding
the 53
rd
week in 2011. The increase was driven by refranchising, positive
franchise same-store sales and new unit development, partially offset by the
LJS and A&W divestitures and franchise store closures. U.S. Franchise and
license fees and income increased 1% in 2011, excluding the 53
rd
week. The
increase was driven by refranchising and new unit development, partially
offset by franchise store closures and franchise same-store sales declines.
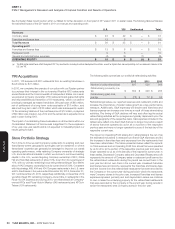
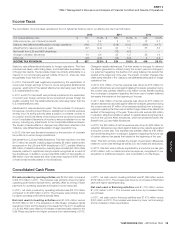
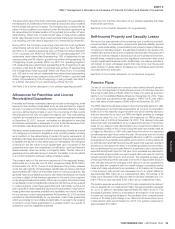
General and Administrative Expenses
Amount % Increase (Decrease)
% Increase (Decrease)
excluding foreign
currency translation
% Increase (Decrease)
excluding foreign
currency translation
and 53rd week
2012 2011 2010 2012 2011 2012 2011 2012 2011
China $ 334 $ 275 $ 216 21 27 19 22 19 22
YRI 414 400 361 3 11 6 7 7 6
U.S. 467 450 492 4 (8) N/A N/A 5 (9)
India 24 22 17 9 28 25 29 25 29
Unallocated 271 225 191 21 18 N/A N/A 22 17
WORLDWIDE $ 1,510 $ 1,372 $ 1,277 10 7 11 5 11 5
The increase in China G&A expenses for 2012, was driven by increased
compensation costs due to higher headcount and wage infl ation and
additional G&A as a result of consolidating Little Sheep.
The increase in China G&A expenses for 2011 was driven by increased
compensation costs due to wage infl ation and higher headcount.
The increase in YRI G&A expenses for 2012 was driven by increased
investment in strategic growth markets, including the acquisition of
restaurants in South Africa in 2011, and increased compensation costs
in the remaining markets.