Pizza Hut 2012 Annual Report Download - page 112
Download and view the complete annual report
Please find page 112 of the 2012 Pizza Hut annual report below. You can navigate through the pages in the report by either clicking on the pages listed below, or by using the keyword search tool below to find specific information within the annual report.-
 1
1 -
2
-
3
-
4
-
5
-
6
-
7
-
8
-
9
-
10
-
11
-
12
-
13
-
14
-
15
-
16
-
17
-
18
-
19
-
20
-
21
-
22
-
23
-
24
-
25
-
26
-
27
-
28
-
29
-
30
-
31
-
32
-
33
-
34
-
35
-
36
-
37
-
38
-
39
-
40
-
41
-
42
-
43
-
44
-
45
-
46
-
47
-
48
-
49
-
50
-
51
-
52
-
53
-
54
-
55
-
56
-
57
-
58
-
59
-
60
-
61
-
62
-
63
-
64
-
65
-
66
-
67
-
68
-
69
-
70
-
71
-
72
-
73
-
74
-
75
-
76
-
77
-
78
-
79
-
80
-
81
-
82
-
83
-
84
-
85
-
86
-
87
-
88
-
89
-
90
-
91
-
92
-
93
-
94
-
95
-
96
-
97
-
98
-
99
-
100
-
101
-
 102
102 -
 103
103 -
 104
104 -
 105
105 -
 106
106 -
 107
107 -
 108
108 -
 109
109 -
 110
110 -
 111
111 -
 112
112 -
 113
113 -
 114
114 -
 115
115 -
 116
116 -
 117
117 -
 118
118 -
 119
119 -
 120
120 -
 121
121 -
 122
122 -
123
-
124
-
125
-
126
-
127
-
128
-
129
-
130
-
131
-
132
-
133
-
134
-
135
-
136
-
137
-
138
-
139
-
140
-
141
-
142
-
143
-
144
-
145
-
146
-
147
-
148
-
149
-
150
-
151
-
152
-
153
-
154
-
155
-
156
-
157
-
158
-
159
-
160
-
161
-
162
-
163
-
164
-
165
-
166
-
167
-
168
-
169
-
170
-
171
-
172
 |
 |

YUM! BRANDS, INC.-2012 Form10-K 20
Form 10-K
PART II
ITEM7Management’s Discussion and Analysis ofFinancial Condition and Results ofOperations
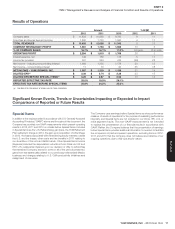
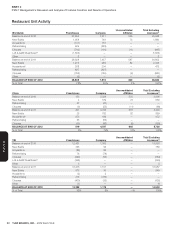
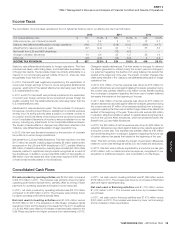
See the System Sales Growth section within our MD&A for further discussion on the impact of 53rd week in 2011 on system sales. The following table summarizes
the estimated impact of the 53rd week in 2011 on revenues and operating profi t:
U.S. YRI Unallocated Total
Revenues
Company sales $ 43 $ 29 $ — $ 72
Franchise and license fees 13 6 — 19
Total Revenues $56 $35 $ — $91
Operating profi t
Franchise and license fees $ 13 $ 6 $ — $ 19
Restaurant profi t 9 6 — 15
General and administrative expenses (4) (4) (1) (9)
OPERATING PROFIT(a) $ 18$ 8$ (1)$ 25
(a) The $25million benefit was offset throughout 2011 by investments, including franchise development incentives, as well as higher-than-normal spending, such as restaurant closures in the
U.S. and YRI.
YRI Acquisitions
In 2011, YRI acquired 68 KFC restaurants from an existing franchisee in
South Africa for $71million.
In 2010, we completed the exercise of our option with our Russian partner
to purchase their interest in the co-branded Rostik’s-KFC restaurants
across Russia and the Commonwealth of Independent States.As a result,
we acquired company ownership of 50 restaurants and gained full rights
and responsibilities as franchisor of 81 restaurants, which our partner
previously managed as master franchisee.We paid cash of $60million,
net of settlement of a long-term note receivable of $11million, and
assumed long-term debt of $10million which was subsequently repaid.
Of the remaining balance of the purchase price of $12million, a payment
of $9million was made in July2012 and the remainder is expected to be
paid in cash during 2013.
The impact of consolidating these businesses on all line-items within our
Consolidated Statement of Income was insignifi cant to the comparison
of our year-over-year results and is not expected to materially impact our
results going forward.
Store Portfolio Strategy
From time to time we sell Company restaurants to existing and new
franchisees where geographic synergies can be obtained or where
franchisees’ expertise can generally be leveraged to improve our overall
operating performance, while retaining Company ownership of strategic
U.S. and international markets in which we choose to continue investing
capital.In the U.S., we are targeting Company ownership of KFC, Pizza
Hut and Taco Bell restaurants of about 10%, down from its current level of
11%, with our primary remaining focus being refranchising at Taco Bell to
about 16% Company ownership from its current level of 20%.Consistent
with this strategy, 468, 404 and 404 Company restaurants in the U.S. were
sold to franchisees in the years ended December29, 2012, December31,
2011 and December25, 2010, respectively. Additionally, in December2012
we refranchised 331 remaining Company-owned dine-in restaurants in the
Pizza Hut UK business and during 2010, we refranchised all Company-
owned KFCs and Pizza Huts in Mexico (345 restaurants) and KFCs in
Taiwan (124 restaurants).
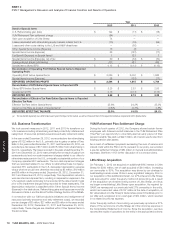
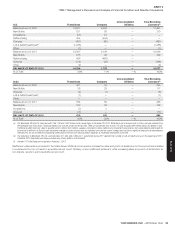
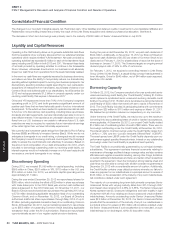
The following table summarizes our worldwide refranchising activities:
2012 2011 2010
Number of units refranchised 897 529 949
Refranchising proceeds, pre-
tax $ 364 $ 246 $ 265
Refranchising (gain) loss,
pre-tax $ (78) $ 72 $ 63
Refranchisings reduce our reported revenues and restaurant profi ts and
increase the importance of system sales growth as a key performance
measure.Additionally, G&A expenses will decline and franchise and
license expense can increase over time as a result of these refranchising
activities.The timing of G&A declines will vary and often lag the actual
refranchising activities as the synergies are typically dependent upon the
size and geography of the respective deals.G&A expenses included in the
tables below refl ect only direct G&A that we no longer incurred as a result
of stores that were operated by us for all or a portion of the respective
previous year and were no longer operated by us as of the last day of the
respective current year.
The impact on Operating Profi t arising from refranchising is the net of (a)
the estimated reductions in restaurant profi t and G&A expenses and (b)
the increase in franchise fees and expenses from the restaurants that
have been refranchised.The tables presented below refl ect the impacts
on Total revenues and on Operating Profi t from stores that were operated
by us for all or some portion of the respective previous year and were no
longer operated by us as of the last day of the respective current year.In
these tables, Decreased Company sales and Decreased Restaurant profi t
represents the amount of Company sales or restaurant profi t earned by
the refranchised restaurants during the period we owned them in the
prior year but did not own them in the current year.Increased Franchise
and license fees and income represents the franchise and license fees
and rent income from the refranchised restaurants that were recorded by
the Company in the current year during periods in which the restaurants
were Company stores in the prior year. Increased Franchise and license
expenses represent primarily rent and depreciation where we continue
to own or lease the underlying property for the refranchised restaurants
that were recorded by the Company in the current year during periods in
which the restaurants were Company stores in the prior year.