Pizza Hut 2012 Annual Report Download - page 56
Download and view the complete annual report
Please find page 56 of the 2012 Pizza Hut annual report below. You can navigate through the pages in the report by either clicking on the pages listed below, or by using the keyword search tool below to find specific information within the annual report.-
 1
1 -
2
-
3
-
4
-
5
-
6
-
7
-
8
-
9
-
10
-
11
-
12
-
13
-
14
-
15
-
16
-
17
-
18
-
19
-
20
-
21
-
22
-
23
-
24
-
25
-
26
-
27
-
28
-
29
-
30
-
31
-
32
-
33
-
34
-
35
-
36
-
37
-
38
-
39
-
40
-
41
-
42
-
43
-
44
-
45
-
 46
46 -
 47
47 -
 48
48 -
 49
49 -
 50
50 -
 51
51 -
 52
52 -
 53
53 -
 54
54 -
 55
55 -
 56
56 -
 57
57 -
 58
58 -
 59
59 -
 60
60 -
 61
61 -
 62
62 -
 63
63 -
 64
64 -
 65
65 -
 66
66 -
67
-
68
-
69
-
70
-
71
-
72
-
73
-
74
-
75
-
76
-
77
-
78
-
79
-
80
-
81
-
82
-
83
-
84
-
85
-
86
-
87
-
88
-
89
-
90
-
91
-
92
-
93
-
94
-
95
-
96
-
97
-
98
-
99
-
100
-
101
-
102
-
103
-
104
-
105
-
106
-
107
-
108
-
109
-
110
-
111
-
112
-
113
-
114
-
115
-
116
-
117
-
118
-
119
-
120
-
121
-
122
-
123
-
124
-
125
-
126
-
127
-
128
-
129
-
130
-
131
-
132
-
133
-
134
-
135
-
136
-
137
-
138
-
139
-
140
-
141
-
142
-
143
-
144
-
145
-
146
-
147
-
148
-
149
-
150
-
151
-
152
-
153
-
154
-
155
-
156
-
157
-
158
-
159
-
160
-
161
-
162
-
163
-
164
-
165
-
166
-
167
-
168
-
169
-
170
-
171
-
172
 |
 |

YUM! BRANDS, INC.-2013Proxy Statement38
Proxy Statement
EXECUTIVE COMPENSATION
The performance targets are the same as those we disclose to
our investors and when determined to be appropriate by our
committee may be slightly above or below disclosed guidance.
Division targets may be adjusted during the year when doing so
is consistent with the objectives and intent at the time the targets
were originally set. In 2012, some division operating profi t growth
targets were adjusted to refl ect certain Company- approved
investments and restaurant divestitures not refl ective of annual
operating performance. These adjustments had no material impact
on our Named Executive Offi cers’ compensation.
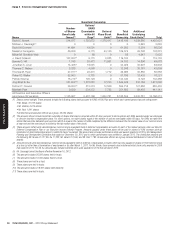
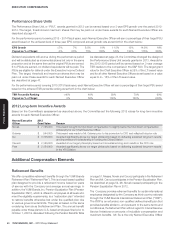
Summary of Earned Annual Incentives for 2012
The table below summarizes how the formula was applied and the actual amounts earned for 2012 performance.
Named
Executive Offi cer
Base Salary
Year End 2012
Annual
Target Bonus
Percentage
Team
Performance
Individual
Performance
Bonus Paid
for 2012 Performance
Novak $ 1,450,000 X 160% X 152% X 130% = $ 4,584,320
Grismer $ 550,000 X 75% X 152% X 130% = $ 760,760
Su $ 1,100,000 X 115% X 129% X 125% = $ 2,039,813
Carucci $ 900,000 X 120% X 155% X 115% = $ 1,846,785
Pant $ 750,000 X 100% X 160% X 135% = $ 1,620,000
Note: Mr.Carucci’s team factor is based on his role as CFO, as well as responsibility for KFC in the U.S. for 4 months at a blend of
90% YUM and 10% KFC team performance and for his role as President for 8 months at 100% YUM team performance.
Detailed Breakdown of 2012 Team Performance
The team performance targets, actual results, weights and overall performance for each measure for our Named Executive Offi cers
are outlined below.
TEAM PERFORMANCE
Named
Executive Offi cer Measures Target Actual
Earned
Award as %
of Target Weighting
Final Team
Performance
Novak, Grismer
and Carucci
Weighted Average Divisions’ Team Factors(1) 150 50% 75
Earnings Per Share Growth
(excluding special items)
10 % 13 % 153 50% 77
TOTAL WEIGHTED TEAM
PERFORMANCE - YUM BRANDS 152
Su Operating Profi t Growth
(excluding impact of foreign exchange) 12 %9 % 48 50% 24
System Sales Growth 15 % 20 % 200 20% 40
System Gross New Builds 550 889 200 20% 40
System Customer Satisfaction 100 165 165 10% 17
TOTAL WEIGHTED TEAM
PERFORMANCE - CHINA DIVISION 121
75% Division/25% YUM TP Factor 129
Pant OperatingProfi tGrowth
(excluding impact of foreign exchange)(2) 10 % 12 % 148 50% 74
System Sales Growth(3) 5.5 %7 % 163 20% 33
System Net Builds 370 515 200 20% 40
System Customer Satisfaction Blended Blended 154 10% 15
TOTAL WEIGHTED TEAM
PERFORMANCE - YRI DIVISION 162
75% Division/25% YUM TP Factor 160
(1) Weighted average based on Division’s contribution to overall operating profit of YUM in 2012.
(2) Actual operating profit growth was adjusted for the impact of certain non-recurring costs within our Pizza Hut U.K. market.
(3) Actual system sales growth was adjusted for the impact of the 53rd week and the divestiture of LJS/A&W in 2011.
Note: Mr. Carucci’s team factor is based on his role as CFO, as well as responsibility for KFC in the U.S. for 4 months at a blend of 90% YUM and 10% KFC team
performance and for his role as President for 8 months at 100% YUM team performance. Due to KFC’s performance this resulted in a 155 team performance for
Mr. Carucci.