Pep Boys 2011 Annual Report Download - page 93
Download and view the complete annual report
Please find page 93 of the 2011 Pep Boys annual report below. You can navigate through the pages in the report by either clicking on the pages listed below, or by using the keyword search tool below to find specific information within the annual report.-
 1
1 -
2
-
3
-
4
-
5
-
6
-
7
-
8
-
9
-
10
-
11
-
12
-
13
-
14
-
15
-
16
-
17
-
18
-
19
-
20
-
21
-
22
-
23
-
24
-
25
-
26
-
27
-
28
-
29
-
30
-
31
-
32
-
33
-
34
-
35
-
36
-
37
-
38
-
39
-
40
-
41
-
42
-
43
-
44
-
45
-
46
-
47
-
48
-
49
-
50
-
51
-
52
-
53
-
54
-
55
-
56
-
57
-
58
-
59
-
60
-
61
-
62
-
63
-
64
-
65
-
66
-
67
-
68
-
69
-
70
-
71
-
72
-
73
-
74
-
75
-
76
-
77
-
78
-
79
-
80
-
81
-
82
-
 83
83 -
 84
84 -
 85
85 -
 86
86 -
 87
87 -
 88
88 -
 89
89 -
 90
90 -
 91
91 -
 92
92 -
 93
93 -
 94
94 -
 95
95 -
 96
96 -
 97
97 -
 98
98 -
 99
99 -
 100
100 -
 101
101 -
 102
102 -
 103
103 -
104
-
105
-
106
-
107
-
108
-
109
-
110
-
111
-
112
-
113
-
114
-
115
-
116
-
117
-
118
-
119
-
120
-
121
-
122
-
123
-
124
-
125
-
126
-
127
-
128
-
129
-
130
-
131
-
132
-
133
-
134
-
135
-
136
-
137
-
138
-
139
-
140
-
141
-
142
-
143
-
144
-
145
-
146
-
147
-
148
-
149
-
150
-
151
-
152
-
153
-
154
-
155
-
156
-
157
-
158
-
159
-
160
-
161
-
162
-
163
-
164
-
165
-
166
-
167
-
168
-
169
-
170
-
171
-
172
 |
 |

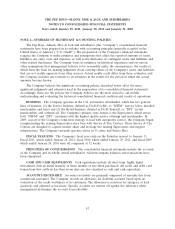
THE PEP BOYS—MANNY, MOE & JACK AND SUBSIDIARIES
NOTES TO CONSOLIDATED FINANCIAL STATEMENTS (Continued)
Years ended January 29, 2011, January 30, 2010 and January 31, 2009
NOTE 1—SUMMARY OF SIGNIFICANT ACCOUNTING POLICIES (Continued)
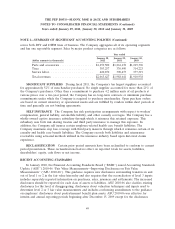
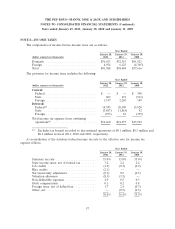
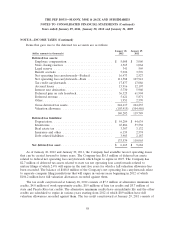
serves both DIY and DIFM lines of business. The Company aggregates all of its operating segments
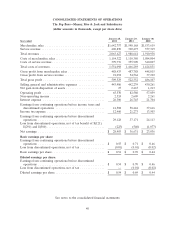
and has one reportable segment. Sales by major product categories are as follows:
Year ended
January 28, January 29, January 30,
(dollar amounts in thousands) 2012 2011 2010
Parts and accessories ................... $1,259,500 $1,261,678 $1,219,396
Tires .............................. 383,257 336,490 314,223
Service labor ......................... 420,870 390,473 377,319
Total revenues ....................... $2,063,627 $1,988,641 $1,910,938
SIGNIFICANT SUPPLIERS During fiscal 2011, the Company’s ten largest suppliers accounted
for approximately 52% of merchandise purchased. No single supplier accounted for more than 21% of
the Company’s purchases. Other than a commitment to purchase 4.2 million units of oil products at
various prices over a two-year period, the Company has no long-term contracts or minimum purchase
commitments under which the Company is required to purchase merchandise. Open purchase orders
are based on current inventory or operational needs and are fulfilled by vendors within short periods of
time and generally are not binding agreements.
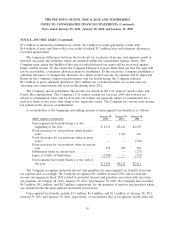
SELF INSURANCE The Company has risk participation arrangements with respect to workers’
compensation, general liability, automobile liability, and other casualty coverages. The Company has a
wholly owned captive insurance subsidiary through which it reinsures this retained exposure. This
subsidiary uses both risk sharing treaties and third party insurance to manage this exposure. In
addition, the Company self insures certain employee-related health care benefit liabilities. The
Company maintains stop loss coverage with third party insurers through which it reinsures certain of its
casualty and health care benefit liabilities. The Company records both liabilities and reinsurance
receivables using actuarial methods utilized in the insurance industry based upon historical claims
experience.
RECLASSIFICATION Certain prior period amounts have been reclassified to conform to current
period presentation. These reclassifications had no effect on reported totals for assets, liabilities,
shareholders’ equity, cash flows or net income.
RECENT ACCOUNTING STANDARDS
In January 2010, the Financial Accounting Standards Board (‘‘FASB’’) issued Accounting Standards
Update (‘‘ASU’’) 2010-06 ‘‘Fair Value Measurements—Improving Disclosures on Fair Value
Measurements’’ (‘‘ASU 2010-06’’). This guidance requires new disclosures surrounding transfers in and
out of level 1 or 2 in the fair value hierarchy and also requires that the reconciliation of level 3 inputs
includes separately reported information on purchases, sales, issuances and settlements. The increased
disclosures should be reported for each class of assets or liabilities. ASU 2010-06 also clarifies existing
disclosures for the level of disaggregating, disclosures about valuation techniques and inputs used to
determine level 2 or 3 fair value measurements and includes conforming amendments to the guidance
on employers’ disclosures about postretirement benefit plan assets. ASU 2010-06 was effective for
interim and annual reporting periods beginning after December 15, 2009 except for the disclosures
49