Pep Boys 2011 Annual Report Download - page 30
Download and view the complete annual report
Please find page 30 of the 2011 Pep Boys annual report below. You can navigate through the pages in the report by either clicking on the pages listed below, or by using the keyword search tool below to find specific information within the annual report.-
 1
1 -
2
-
3
-
4
-
5
-
6
-
7
-
8
-
9
-
10
-
11
-
12
-
13
-
14
-
15
-
16
-
17
-
18
-
19
-
 20
20 -
 21
21 -
 22
22 -
 23
23 -
 24
24 -
 25
25 -
 26
26 -
 27
27 -
 28
28 -
 29
29 -
 30
30 -
 31
31 -
 32
32 -
 33
33 -
 34
34 -
 35
35 -
 36
36 -
 37
37 -
 38
38 -
 39
39 -
 40
40 -
41
-
42
-
43
-
44
-
45
-
46
-
47
-
48
-
49
-
50
-
51
-
52
-
53
-
54
-
55
-
56
-
57
-
58
-
59
-
60
-
61
-
62
-
63
-
64
-
65
-
66
-
67
-
68
-
69
-
70
-
71
-
72
-
73
-
74
-
75
-
76
-
77
-
78
-
79
-
80
-
81
-
82
-
83
-
84
-
85
-
86
-
87
-
88
-
89
-
90
-
91
-
92
-
93
-
94
-
95
-
96
-
97
-
98
-
99
-
100
-
101
-
102
-
103
-
104
-
105
-
106
-
107
-
108
-
109
-
110
-
111
-
112
-
113
-
114
-
115
-
116
-
117
-
118
-
119
-
120
-
121
-
122
-
123
-
124
-
125
-
126
-
127
-
128
-
129
-
130
-
131
-
132
-
133
-
134
-
135
-
136
-
137
-
138
-
139
-
140
-
141
-
142
-
143
-
144
-
145
-
146
-
147
-
148
-
149
-
150
-
151
-
152
-
153
-
154
-
155
-
156
-
157
-
158
-
159
-
160
-
161
-
162
-
163
-
164
-
165
-
166
-
167
-
168
-
169
-
170
-
171
-
172
 |
 |

24
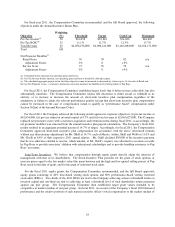
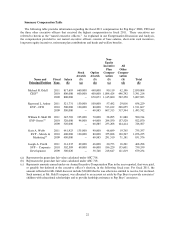
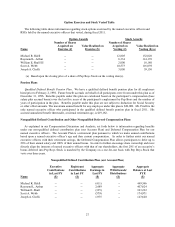
Grants of Plan Based Awards
The following table shows (i) potential payouts under our short-term incentive program assuming specified pre-
established corporate objectives were achieved in fiscal 2011 and (ii) the customary annual equity grants made at the
beginning of fiscal 2011 in respect of fiscal 2010 service.
Estimated Potential Payouts Under
Non-Equity Incentive Plan Awards(a)
Name
Grant
Date
Thres-
hold
($)
Target
($)
Cash
Cap
($)
Maximum
($)
All
Other
Stock
Awards:
Number
of
Shares
of Stock
or Units
(#)
All
Other
Option
Awards:
Number
of
Securi-
ties
Underly-
ing
Options
(#)
Exercise
or Base
Price of
Option
Awards
($/Sh)
Grant
Date
Fair
Value of
Stock
and
Option
Awards
($)
(b)
Michael R. Odell -- 410,000 820,000
1,230,000
1,640,000 -- -- -- --
03/29/11 -- --
--
-- -- 81,331 12.30 440,000
03/29/11 -- --
--
-- 52,885 -- -- 660,000
Raymond L. Arthur -- 196,875 393,750
590,625
787,500 -- -- -- --
03/29/11 -- --
--
-- -- 18,484 12.30 100,000
03/29/11 -- --
--
-- 12,019 -- -- 150,000
William E. Shull III -- 131,250 262,500
393,750
525,000 -- -- --
03/29/11 -- --
--
-- -- 12,939 12.30 70,000
03/29/11 -- --
--
-- 8,413 -- -- 105,000
Scott A. Webb -- 168,750 337,500
506,250
675,000 -- -- --
03/29/11 -- --
--
-- -- 16,636 12.30 90,000
03/29/11 -- --
--
-- 10,817 -- -- 135,000
Joseph A. Cirelli -- 70,875 141,750
212,625
283,500 -- -- --
03/29/11 -- --
--
-- -- 8,503 12.30 46,000
03/29/11 -- --
--
-- 5,529 -- -- 69,000
(a) These columns reflect threshold, target, cash cap and maximum amounts that were potentially payable
under our Annual Incentive Bonus Plan to our named executive officers if certain corporate targets pre-
established by our Compensation Committee were achieved in fiscal 2011. See “Compensation Discussion
and Analysis” for a full discussion of our Annual Incentive Bonus Plan and “Summary Compensation
Table” for amounts actually earned in fiscal 2011.
(b) Represents the grant-date fair value calculated under ASC 718.