Pep Boys 2011 Annual Report Download - page 77
Download and view the complete annual report
Please find page 77 of the 2011 Pep Boys annual report below. You can navigate through the pages in the report by either clicking on the pages listed below, or by using the keyword search tool below to find specific information within the annual report.-
 1
1 -
2
-
3
-
4
-
5
-
6
-
7
-
8
-
9
-
10
-
11
-
12
-
13
-
14
-
15
-
16
-
17
-
18
-
19
-
20
-
21
-
22
-
23
-
24
-
25
-
26
-
27
-
28
-
29
-
30
-
31
-
32
-
33
-
34
-
35
-
36
-
37
-
38
-
39
-
40
-
41
-
42
-
43
-
44
-
45
-
46
-
47
-
48
-
49
-
50
-
51
-
52
-
53
-
54
-
55
-
56
-
57
-
58
-
59
-
60
-
61
-
62
-
63
-
64
-
65
-
66
-
 67
67 -
 68
68 -
 69
69 -
 70
70 -
 71
71 -
 72
72 -
 73
73 -
 74
74 -
 75
75 -
 76
76 -
 77
77 -
 78
78 -
 79
79 -
 80
80 -
 81
81 -
 82
82 -
 83
83 -
 84
84 -
 85
85 -
 86
86 -
 87
87 -
88
-
89
-
90
-
91
-
92
-
93
-
94
-
95
-
96
-
97
-
98
-
99
-
100
-
101
-
102
-
103
-
104
-
105
-
106
-
107
-
108
-
109
-
110
-
111
-
112
-
113
-
114
-
115
-
116
-
117
-
118
-
119
-
120
-
121
-
122
-
123
-
124
-
125
-
126
-
127
-
128
-
129
-
130
-
131
-
132
-
133
-
134
-
135
-
136
-
137
-
138
-
139
-
140
-
141
-
142
-
143
-
144
-
145
-
146
-
147
-
148
-
149
-
150
-
151
-
152
-
153
-
154
-
155
-
156
-
157
-
158
-
159
-
160
-
161
-
162
-
163
-
164
-
165
-
166
-
167
-
168
-
169
-
170
-
171
-
172
 |
 |
The expense under these plans for fiscal 2011, 2010 and 2009 was $1.4 million, $6.3 million and
$6.4 million, respectively. Pension expense for the Plan is calculated based upon a number of actuarial
assumptions, including an expected return on plan assets of 6.8% and a discount rate of 5.7%. In
developing the expected return on asset assumptions, we evaluated input from our actuaries, including
their review of asset class return expectations. The discount rate utilized for the Plan is based on a
model bond portfolio with durations that match the expected benefit payment pattern. We continue to
evaluate our actuarial assumptions and make adjustments as necessary for the existing plans. See
Note 13 of the Notes to Consolidated Financial Statements in ‘‘Item 8 Financial Statements and
Supplementary Data’’ for further discussion of our pension plans.
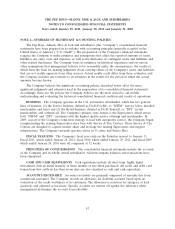
CRITICAL ACCOUNTING POLICIES AND ESTIMATES
Management’s Discussion and Analysis of Financial Condition and Results of Operations discusses
our consolidated financial statements, which have been prepared in accordance with accounting
principles generally accepted in the United States of America. The preparation of these financial
statements requires management to make estimates and assumptions that affect the reported amounts
of assets and liabilities, the disclosure of contingent assets and liabilities at the date of the consolidated
financial statements and the amounts of revenues and expenses during the reporting period. On an
on-going basis, management evaluates its estimates and judgments, including those related to customer
incentives, product returns and warranty obligations, bad debts, inventories, income taxes, financing
operations, retirement benefits, share-based compensation, risk participation agreements, contingencies
and litigation. Management bases its estimates and judgments on historical experience and on various
other factors that are believed to be reasonable under the circumstances, the results of which form the
basis for making judgments about the carrying values of assets and liabilities that are not readily
apparent from other sources. Actual results may differ from these estimates under different
assumptions or conditions.
We believe that the following represent our more critical estimates and assumptions used in the
preparation of the consolidated financial statements:
• Inventory is stated at lower of cost, as determined under the last-in, first-out (LIFO) method, or
market. Our inventory, consists primarily of automotive parts and accessories, is used on
vehicles. Because of the relatively long lives of vehicles, along with our historical experience of
returning most excess inventory to our vendors for full credit, the risk of obsolescence is
minimal. We establish a reserve for excess inventory for instances where less than full credit will
be received for such returns and where we anticipate items will be sold at retail prices that are
less than recorded costs. The reserve is based on management’s judgment, including estimates
and assumptions regarding marketability of products, the market value of inventory to be sold in
future periods and on historical experiences where we received less than full credit from vendors
for product returns. If our estimates regarding excess inventory are inaccurate, we may incur
losses or gains that could be material. A 10% difference in our inventory reserves as of
January 28 2012, would have affected net income by approximately $0.3 million in fiscal 2011.
• We record reserves for future sales returns, customer incentives, warranty claims and inventory
shrinkage. The reserves are based on expected returns of products and historical claims and
inventory shrinkage experience. If actual experience differs from historical levels, revisions in our
estimates may be required. A 10% change in these reserves at January 28, 2012 would have
affected net earnings by approximately $0.9 million for fiscal 2011.
• We have risk participation arrangements with respect to workers’ compensation, general liability,
automobile liability, other casualty coverages and health care insurance, including stop loss
coverage with third party insurers to limit our total exposure. A reserve for the liabilities
associated with these agreements is established using generally accepted actuarial methods
33