Pep Boys 2011 Annual Report Download - page 148
Download and view the complete annual report
Please find page 148 of the 2011 Pep Boys annual report below. You can navigate through the pages in the report by either clicking on the pages listed below, or by using the keyword search tool below to find specific information within the annual report.-
 1
1 -
2
-
3
-
4
-
5
-
6
-
7
-
8
-
9
-
10
-
11
-
12
-
13
-
14
-
15
-
16
-
17
-
18
-
19
-
20
-
21
-
22
-
23
-
24
-
25
-
26
-
27
-
28
-
29
-
30
-
31
-
32
-
33
-
34
-
35
-
36
-
37
-
38
-
39
-
40
-
41
-
42
-
43
-
44
-
45
-
46
-
47
-
48
-
49
-
50
-
51
-
52
-
53
-
54
-
55
-
56
-
57
-
58
-
59
-
60
-
61
-
62
-
63
-
64
-
65
-
66
-
67
-
68
-
69
-
70
-
71
-
72
-
73
-
74
-
75
-
76
-
77
-
78
-
79
-
80
-
81
-
82
-
83
-
84
-
85
-
86
-
87
-
88
-
89
-
90
-
91
-
92
-
93
-
94
-
95
-
96
-
97
-
98
-
99
-
100
-
101
-
102
-
103
-
104
-
105
-
106
-
107
-
108
-
109
-
110
-
111
-
112
-
113
-
114
-
115
-
116
-
117
-
118
-
119
-
120
-
121
-
122
-
123
-
124
-
125
-
126
-
127
-
128
-
129
-
130
-
131
-
132
-
133
-
134
-
135
-
136
-
137
-
 138
138 -
 139
139 -
 140
140 -
 141
141 -
 142
142 -
 143
143 -
 144
144 -
 145
145 -
 146
146 -
 147
147 -
 148
148 -
 149
149 -
 150
150 -
 151
151 -
 152
152 -
 153
153 -
 154
154 -
 155
155 -
 156
156 -
 157
157 -
 158
158 -
159
-
160
-
161
-
162
-
163
-
164
-
165
-
166
-
167
-
168
-
169
-
170
-
171
-
172
 |
 |

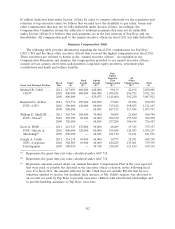
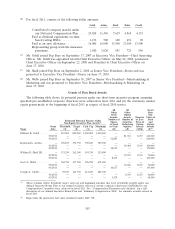
Outstanding Equity Awards at Fiscal Year-End Table
The following table shows information regarding unexercised stock options and unvested RSUs
held by the named executive officers as of January 28, 2012.
Option Awards Stock Awards
Market
Value of
Number of Number of Number of Shares or
Securities Securities Shares or Units of
Underlying Underlying Option Units of Stock That
Unexercised Unexercised Exercise Option Stock That Have Not
Options (#) Options (#) Price Expiration Have Not Yet Vested
Name Exercisable Unexercisable ($) Date Vested (#) ($)(a)
Michael R. Odell ........... 6,000 0 14.7750 9/17/2014 — —
10,000 0 12.0600 2/28/2015 — —
266,666 133,334(b) 3.1200 2/26/2016 — —
31,152 62,306(c) 10.2700 3/30/2017 — —
0 81,331(d) 12.3000 3/29/2018 — —
— — — — 58,027(e) 700,966
— — — — 52,885(f) 638,851
Raymond L. Arthur ......... 100,000 0 9.0950 5/01/2015 — —
26,667 13,333(b) 3.1200 2/26/2016 — —
6,230 12,462(c) 10.2700 3/30/2017 — —
0 18,484(d) 12.3000 3/29/2018 — —
— — — — 11,605(e) 140,188
— — — — 12,019(f) 145,190
William E. Shull ............ 2,000 0 9.2550 9/02/2015 — —
26,667 13,333(b) 3.1200 2/26/2016 — —
4,984 9,969(c) 10.2700 3/30/2017 — —
0 12,939(d) 12.3000 3/29/2018 — —
— — — — 9,284(e) 112,151
— — — — 8,413(f) 101,629
Scott A. Webb ............. 20,000 0 12.0600 2/28/2015 — —
26,667 13,333(b) 3.1200 2/26/2016 — —
6,230 12,462(c) 10.2700 3/30/2017 — —
0 16,636(d) 12.3000 3/29/2018 — —
— — — — 11,605(e) 140,188
— — — — 10,817(f) 130,669
Joseph A. Cirelli ........... 20,000 0 16.1250 5/29/2012 — —
5,000 0 17.5400 2/25/2012 — —
1,500 0 15.8550 2/27/2013 — —
2,000 0 15.9650 2/15/2014 — —
2,000 0 12.0600 2/28/2015 — —
15,000 7,500(b) 3.1200 2/26/2016 — —
3,582 7,166(c) 10.2700 3/30/2017 — —
0 8,503(d) 12.3000 3/29/2018 — —
— — — — 6,673(e) 80,610
— — — — 5,529(f) 66,790
(a) Based upon the closing price of a share of Pep Boys Stock on January 27, 2012 ($12.08).
104