Pep Boys 2011 Annual Report Download - page 68
Download and view the complete annual report
Please find page 68 of the 2011 Pep Boys annual report below. You can navigate through the pages in the report by either clicking on the pages listed below, or by using the keyword search tool below to find specific information within the annual report.-
 1
1 -
2
-
3
-
4
-
5
-
6
-
7
-
8
-
9
-
10
-
11
-
12
-
13
-
14
-
15
-
16
-
17
-
18
-
19
-
20
-
21
-
22
-
23
-
24
-
25
-
26
-
27
-
28
-
29
-
30
-
31
-
32
-
33
-
34
-
35
-
36
-
37
-
38
-
39
-
40
-
41
-
42
-
43
-
44
-
45
-
46
-
47
-
48
-
49
-
50
-
51
-
52
-
53
-
54
-
55
-
56
-
57
-
 58
58 -
 59
59 -
 60
60 -
 61
61 -
 62
62 -
 63
63 -
 64
64 -
 65
65 -
 66
66 -
 67
67 -
 68
68 -
 69
69 -
 70
70 -
 71
71 -
 72
72 -
 73
73 -
 74
74 -
 75
75 -
 76
76 -
 77
77 -
 78
78 -
79
-
80
-
81
-
82
-
83
-
84
-
85
-
86
-
87
-
88
-
89
-
90
-
91
-
92
-
93
-
94
-
95
-
96
-
97
-
98
-
99
-
100
-
101
-
102
-
103
-
104
-
105
-
106
-
107
-
108
-
109
-
110
-
111
-
112
-
113
-
114
-
115
-
116
-
117
-
118
-
119
-
120
-
121
-
122
-
123
-
124
-
125
-
126
-
127
-
128
-
129
-
130
-
131
-
132
-
133
-
134
-
135
-
136
-
137
-
138
-
139
-
140
-
141
-
142
-
143
-
144
-
145
-
146
-
147
-
148
-
149
-
150
-
151
-
152
-
153
-
154
-
155
-
156
-
157
-
158
-
159
-
160
-
161
-
162
-
163
-
164
-
165
-
166
-
167
-
168
-
169
-
170
-
171
-
172
 |
 |
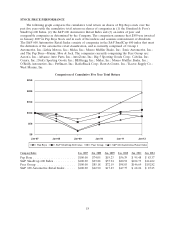
offset by an increase in the average transaction amount per customer. While our total revenue figures
were favorably impacted by the opening or acquisition of new stores, a new store is not added to our
comparable store sales until it reaches its 13th month of operation. Non-comparable stores contributed
an additional $86.6 million of total revenue in fiscal 2011 as compared to the prior year.
Total merchandise sales increased 2.8%, or $44.6 million, to $1,642.8 million in fiscal 2011,
compared to $1,598.2 million in fiscal 2010. The increase in merchandise sales was due to our non-
comparable stores which contributed an additional $58.4 million of sales during the year, partially offset
by a decline in comparable store merchandise sales of 0.9%, or $13.8 million. The decrease in
comparable store merchandise sales was comprised of a 2.3% decline in our retail business which was
mostly offset by a 1.9% increase in merchandise sold through our service business as a result of
increased tire and installed part sales. Total service revenue increased 7.8%, or $30.4 million, to $420.9
million in fiscal 2011 from $390.5 million in the prior year. The increase in service revenue was
comprised of a $2.2 million, or 0.6%, increase in comparable store service revenue and $28.2 million of
service revenue from our new non-comparable stores.
We believe that comparable store customer counts decreased due to macroeconomic conditions,
while the average transaction amount per customer increased due to selling price increases
implemented to reflect the inflation in product acquisition costs. We believe the significant increase in
gasoline prices led to a decline in miles driven, which combined with the financial burden of higher
gasoline prices, continued high unemployment and negative consumer confidence in the overall U.S.
economy depressed our fiscal 2011 sales. These negative economic conditions were somewhat mitigated
by the continued aging of the U.S. light vehicle fleet as consumers spent more money on maintaining
their vehicles as opposed to buying new vehicles. Over the long-term, we believe utilizing innovative
marketing programs to communicate our value-priced, differentiated service and merchandise
assortment will drive increased customer counts and our continued focus on delivering a better
customer experience than our competitors will convert those increased customer counts into sales
improvements consistently over all lines of business.
Total gross profit decreased by $12.8 million, or 2.5%, to $509.5 million in fiscal 2011 from $522.4
million in fiscal 2010. Total gross profit margin decreased to 24.7% for fiscal 2011 from 26.3% for fiscal
2010. The decrease in total gross profit margin was primarily due to the opening or acquisition of new
Service & Tire Centers. The 85 Big 10 locations acquired in the second quarter of 2011 lowered total
gross profit margin for fiscal 2011 by 50 basis points. The Big 10 locations were dilutive to total gross
profit margin primarily due to mix of sales being more highly concentrated in tires which have lower
product margins combined with higher rent and payroll costs as a percent of total sales. The organic
new stores opened by the Company, which are in their ramp up stage for sales while incurring their full
amount of fixed expenses, including payroll and occupancy costs (rent, utilities and building
maintenance), negatively affected total gross profit margin by 81 basis points and 42 basis points for
fiscal 2011 and 2010, respectively. The current year also included a net charge of $0.5 million
comprised of a $1.6 million asset impairment charge which was mostly offset by a $1.1 million
reduction in the reserve for excess inventory. The prior year included a net benefit of $5.9 million
comprised of a reduction in the reserve for excess inventory of $5.9 million and a $1.0 million reversal
of an inventory accrual partially offset by an asset impairment charge of $1.0 million. Excluding the
impact of both the acquired and the new organic Service & Tire Centers and the unusual items noted
above, the total gross profit margin declined by 33 basis points to 26.1% from 26.4% in the prior year.
This decline was mostly due to a shift in sales to lower margin tires and increased tire pricing pressure.
While the acquired and new organic Service & Tire Centers have had a negative impact on total gross
profit margin, these Service & Tire Centers positively contributed to total gross profit for the current
fiscal year.
Gross profit from merchandise sales increased by $0.6 million, or 0.1%, to $488.4 million for fiscal
2011 from $487.8 million in fiscal 2010. Gross profit margin from merchandise sales decreased to
24