Pep Boys 2011 Annual Report Download - page 122
Download and view the complete annual report
Please find page 122 of the 2011 Pep Boys annual report below. You can navigate through the pages in the report by either clicking on the pages listed below, or by using the keyword search tool below to find specific information within the annual report.-
 1
1 -
2
-
3
-
4
-
5
-
6
-
7
-
8
-
9
-
10
-
11
-
12
-
13
-
14
-
15
-
16
-
17
-
18
-
19
-
20
-
21
-
22
-
23
-
24
-
25
-
26
-
27
-
28
-
29
-
30
-
31
-
32
-
33
-
34
-
35
-
36
-
37
-
38
-
39
-
40
-
41
-
42
-
43
-
44
-
45
-
46
-
47
-
48
-
49
-
50
-
51
-
52
-
53
-
54
-
55
-
56
-
57
-
58
-
59
-
60
-
61
-
62
-
63
-
64
-
65
-
66
-
67
-
68
-
69
-
70
-
71
-
72
-
73
-
74
-
75
-
76
-
77
-
78
-
79
-
80
-
81
-
82
-
83
-
84
-
85
-
86
-
87
-
88
-
89
-
90
-
91
-
92
-
93
-
94
-
95
-
96
-
97
-
98
-
99
-
100
-
101
-
102
-
103
-
104
-
105
-
106
-
107
-
108
-
109
-
110
-
111
-
 112
112 -
 113
113 -
 114
114 -
 115
115 -
 116
116 -
 117
117 -
 118
118 -
 119
119 -
 120
120 -
 121
121 -
 122
122 -
 123
123 -
 124
124 -
 125
125 -
 126
126 -
 127
127 -
 128
128 -
 129
129 -
 130
130 -
 131
131 -
 132
132 -
133
-
134
-
135
-
136
-
137
-
138
-
139
-
140
-
141
-
142
-
143
-
144
-
145
-
146
-
147
-
148
-
149
-
150
-
151
-
152
-
153
-
154
-
155
-
156
-
157
-
158
-
159
-
160
-
161
-
162
-
163
-
164
-
165
-
166
-
167
-
168
-
169
-
170
-
171
-
172
 |
 |

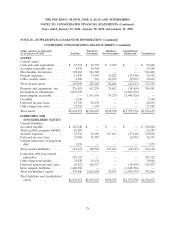
THE PEP BOYS—MANNY, MOE & JACK AND SUBSIDIARIES
NOTES TO CONSOLIDATED FINANCIAL STATEMENTS (Continued)
Years ended January 29, 2011, January 30, 2010 and January 31, 2009
NOTE 20—SUPPLEMENTAL GUARANTOR INFORMATION (Continued)
CONDENSED CONSOLIDATING BALANCE SHEET (Continued)
(dollar amounts in thousands) Subsidiary Subsidiary Consolidation/
As of January 29, 2011 Pep Boys Guarantors Non-Guarantors Elimination Consolidated
ASSETS
Current assets:
Cash and cash equivalents ...... $ 37,912 $ 42,779 $ 9,549 $ — $ 90,240
Accounts receivable, net ........ 8,976 10,564 — — 19,540
Merchandise inventories ........ 198,062 366,340 — — 564,402
Prepaid expenses ............. 11,839 17,649 16,202 (17,148) 28,542
Other current assets .......... 2,260 936 62,655 (5,039) 60,812
Total current assets ........... 259,049 438,268 88,406 (22,187) 763,536
Property and equipment—net .... 236,853 452,230 30,862 (18,964) 700,981
Investment in subsidiaries ...... 2,093,479 — — (2,093,479) —
Intercompany receivable ....... — 1,361,656 79,270 (1,440,926) —
Goodwill ................... 2,549 — — — 2,549
Deferred income taxes ......... 15,749 50,270 — — 66,019
Other long-term assets ......... 22,392 1,195 — — 23,587
Total assets ................. $2,630,071 $2,303,619 $198,538 $(3,575,556) $1,556,672
LIABILITIES AND
STOCKHOLDERS’ EQUITY
Current liabilities:
Accounts payable ............. $ 210,440 $ — $ — $ — $ 210,440
Trade payable program liability . . . 56,287 — — — 56,287
Accrued expenses ............ 23,341 62,168 167,667 (17,148) 236,028
Deferred income taxes ......... 23,024 38,350 — (5,039) 56,335
Current maturities of long-term
debt .................... 1,079 — — — 1,079
Total current liabilities ......... 314,171 100,518 167,667 (22,187) 560,169
Long-term debt less current
maturities ................ 295,122 — — — 295,122
Other long-term liability ........ 35,870 34,176 — — 70,046
Deferred gain from asset sales . . . 65,522 106,317 — (18,964) 152,875
Intercompany liabilities ........ 1,440,926 — — (1,440,926) —
Total stockholders’ equity ....... 478,460 2,062,608 30,871 (2,093,479) 478,460
Total liabilities and stockholders’
equity ................... $2,630,071 $2,303,619 $198,538 $(3,575,556) $1,556,672
78