Pep Boys 2011 Annual Report Download - page 124
Download and view the complete annual report
Please find page 124 of the 2011 Pep Boys annual report below. You can navigate through the pages in the report by either clicking on the pages listed below, or by using the keyword search tool below to find specific information within the annual report.-
 1
1 -
2
-
3
-
4
-
5
-
6
-
7
-
8
-
9
-
10
-
11
-
12
-
13
-
14
-
15
-
16
-
17
-
18
-
19
-
20
-
21
-
22
-
23
-
24
-
25
-
26
-
27
-
28
-
29
-
30
-
31
-
32
-
33
-
34
-
35
-
36
-
37
-
38
-
39
-
40
-
41
-
42
-
43
-
44
-
45
-
46
-
47
-
48
-
49
-
50
-
51
-
52
-
53
-
54
-
55
-
56
-
57
-
58
-
59
-
60
-
61
-
62
-
63
-
64
-
65
-
66
-
67
-
68
-
69
-
70
-
71
-
72
-
73
-
74
-
75
-
76
-
77
-
78
-
79
-
80
-
81
-
82
-
83
-
84
-
85
-
86
-
87
-
88
-
89
-
90
-
91
-
92
-
93
-
94
-
95
-
96
-
97
-
98
-
99
-
100
-
101
-
102
-
103
-
104
-
105
-
106
-
107
-
108
-
109
-
110
-
111
-
112
-
113
-
 114
114 -
 115
115 -
 116
116 -
 117
117 -
 118
118 -
 119
119 -
 120
120 -
 121
121 -
 122
122 -
 123
123 -
 124
124 -
 125
125 -
 126
126 -
 127
127 -
 128
128 -
 129
129 -
 130
130 -
 131
131 -
 132
132 -
 133
133 -
 134
134 -
135
-
136
-
137
-
138
-
139
-
140
-
141
-
142
-
143
-
144
-
145
-
146
-
147
-
148
-
149
-
150
-
151
-
152
-
153
-
154
-
155
-
156
-
157
-
158
-
159
-
160
-
161
-
162
-
163
-
164
-
165
-
166
-
167
-
168
-
169
-
170
-
171
-
172
 |
 |

THE PEP BOYS—MANNY, MOE & JACK AND SUBSIDIARIES
NOTES TO CONSOLIDATED FINANCIAL STATEMENTS (Continued)
Years ended January 29, 2011, January 30, 2010 and January 31, 2009
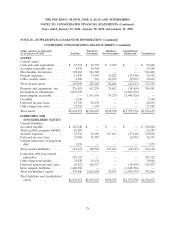
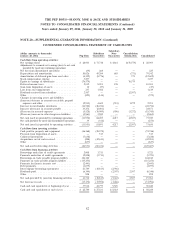
NOTE 20—SUPPLEMENTAL GUARANTOR INFORMATION (Continued)
CONDENSED CONSOLIDATING STATEMENT OF OPERATIONS (Continued)
(dollar amounts in thousands) Subsidiary Subsidiary Consolidation/
Year ended January 29, 2011 Pep Boys Guarantors Non-Guarantors Elimination Consolidated
Merchandise sales ............. $550,017 $1,048,151 $ — $ — $1,598,168
Service revenue ............... 140,716 249,757 — — 390,473
Other revenue ................ — — 22,944 (22,944) —
Total revenues ................ 690,733 1,297,908 22,944 (22,944) 1,988,641
Costs of merchandise sales ....... 387,425 724,586 — (1,631) 1,110,380
Costs of service revenue ......... 124,675 231,387 — (153) 355,909
Costs of other revenue .......... — — 16,709 (16,709) —
Total costs of revenues .......... 512,100 955,973 16,709 (18,493) 1,466,289
Gross profit from merchandise sales 162,592 323,565 — 1,631 487,788
Gross profit from service revenue . . 16,041 18,370 — 153 34,564
Gross profit from other revenue . . . — — 6,235 (6,235) —
Total gross profit .............. 178,633 341,935 6,235 (4,451) 522,352
Selling, general and administrative
expenses ................... 158,699 290,111 346 (6,917) 442,239
Net gain from dispositions of assets . 1,873 594 — — 2,467
Operating profit ............... 21,807 52,418 5,889 2,466 82,580
Non-operating (expenses) income . . (16,271) 81,965 2,468 (65,553) 2,609
Interest expenses (income) ....... 65,422 26,497 (2,087) (63,087) 26,745
(Loss) earnings from continuing
operations before income taxes . . (59,886) 107,886 10,444 — 58,444
Income tax (benefit) expenses ..... (20,064) 37,666 3,671 — 21,273
Equity in earnings of subsidiaries . . 76,519 — — (76,519) —
Earnings (loss) from continuing
operations ................. 36,697 70,220 6,773 (76,519) 37,171
Loss from discontinued operations,
net of tax.................. (66) (474) — — (540)
Net earnings (loss) ............. $ 36,631 $ 69,746 $ 6,773 $(76,519) $ 36,631
80