Pep Boys 2011 Annual Report Download - page 64
Download and view the complete annual report
Please find page 64 of the 2011 Pep Boys annual report below. You can navigate through the pages in the report by either clicking on the pages listed below, or by using the keyword search tool below to find specific information within the annual report.-
 1
1 -
2
-
3
-
4
-
5
-
6
-
7
-
8
-
9
-
10
-
11
-
12
-
13
-
14
-
15
-
16
-
17
-
18
-
19
-
20
-
21
-
22
-
23
-
24
-
25
-
26
-
27
-
28
-
29
-
30
-
31
-
32
-
33
-
34
-
35
-
36
-
37
-
38
-
39
-
40
-
41
-
42
-
43
-
44
-
45
-
46
-
47
-
48
-
49
-
50
-
51
-
52
-
53
-
 54
54 -
 55
55 -
 56
56 -
 57
57 -
 58
58 -
 59
59 -
 60
60 -
 61
61 -
 62
62 -
 63
63 -
 64
64 -
 65
65 -
 66
66 -
 67
67 -
 68
68 -
 69
69 -
 70
70 -
 71
71 -
 72
72 -
 73
73 -
 74
74 -
75
-
76
-
77
-
78
-
79
-
80
-
81
-
82
-
83
-
84
-
85
-
86
-
87
-
88
-
89
-
90
-
91
-
92
-
93
-
94
-
95
-
96
-
97
-
98
-
99
-
100
-
101
-
102
-
103
-
104
-
105
-
106
-
107
-
108
-
109
-
110
-
111
-
112
-
113
-
114
-
115
-
116
-
117
-
118
-
119
-
120
-
121
-
122
-
123
-
124
-
125
-
126
-
127
-
128
-
129
-
130
-
131
-
132
-
133
-
134
-
135
-
136
-
137
-
138
-
139
-
140
-
141
-
142
-
143
-
144
-
145
-
146
-
147
-
148
-
149
-
150
-
151
-
152
-
153
-
154
-
155
-
156
-
157
-
158
-
159
-
160
-
161
-
162
-
163
-
164
-
165
-
166
-
167
-
168
-
169
-
170
-
171
-
172
 |
 |
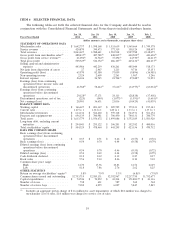
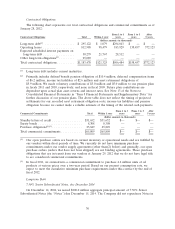
(2) Includes a tax benefit of $3.6 million due to the release of valuation allowances on state net operating loss
carryforwards and credits.
(3) Includes a pretax benefit of $5.9 million due to the reduction in reserve for excess inventory which reduced
merchandise cost of sales and an aggregate pretax charge of $1.0 million for asset impairment, of which
$0.8 million was charged to merchandise cost of sales and $0.2 million was charged to service cost of sales.
(4) Includes an aggregate pretax charge of $3.1 million for asset impairment, of which $2.2 million was charged to
merchandise cost of sales, $0.7 million was charged to service cost of sales and $0.2 million (pretax) was charged
to discontinued operations.
(5) Includes an aggregate pretax charge of $5.4 million for asset impairment, of which $2.8 million was charged to
merchandise cost of sales, $0.6 million was charged to service cost of sales and $1.9 million (pretax) was charged
to discontinued operations.
(6) Includes an aggregate pretax charge of $11.0 million for the asset impairment and closure of 31 stores, of which
$5.4 million was charged to merchandise cost of sales, $1.8 million was charged to service cost of sales and $3.8
million (pretax) was charged to discontinued operations. In addition, we recorded a pretax $32.8 million
inventory impairment charge to cost of merchandise sales for the discontinuance of certain product offerings.
(7) Fiscal 2009 includes a gain from debt retirement of $6.2 million. Fiscal 2008 includes a gain from debt
retirement of $3.5 million, partially offset by a $1.2 million charge for deferred financing costs.
(8) Gross profit from merchandise sales includes the cost of products sold, buying, warehousing and store occupancy
costs. Gross profit from service revenue includes the cost of installed products sold, buying, warehousing, service
payroll and related employee benefits and occupancy costs. Occupancy costs include utilities, rents, real estate
and property taxes, repairs and maintenance and depreciation and amortization expenses. Our gross profit may
not be comparable to those of our competitors due to differences in industry practice regarding the classification
of certain costs.
(9) Return on average stockholders’ equity is calculated by taking the net earnings (loss) for the period divided by
average stockholders’ equity for the year.
(10) Includes the purchase of master lease assets for $117.1 million.
20