Pep Boys 2011 Annual Report Download - page 123
Download and view the complete annual report
Please find page 123 of the 2011 Pep Boys annual report below. You can navigate through the pages in the report by either clicking on the pages listed below, or by using the keyword search tool below to find specific information within the annual report.-
 1
1 -
2
-
3
-
4
-
5
-
6
-
7
-
8
-
9
-
10
-
11
-
12
-
13
-
14
-
15
-
16
-
17
-
18
-
19
-
20
-
21
-
22
-
23
-
24
-
25
-
26
-
27
-
28
-
29
-
30
-
31
-
32
-
33
-
34
-
35
-
36
-
37
-
38
-
39
-
40
-
41
-
42
-
43
-
44
-
45
-
46
-
47
-
48
-
49
-
50
-
51
-
52
-
53
-
54
-
55
-
56
-
57
-
58
-
59
-
60
-
61
-
62
-
63
-
64
-
65
-
66
-
67
-
68
-
69
-
70
-
71
-
72
-
73
-
74
-
75
-
76
-
77
-
78
-
79
-
80
-
81
-
82
-
83
-
84
-
85
-
86
-
87
-
88
-
89
-
90
-
91
-
92
-
93
-
94
-
95
-
96
-
97
-
98
-
99
-
100
-
101
-
102
-
103
-
104
-
105
-
106
-
107
-
108
-
109
-
110
-
111
-
112
-
 113
113 -
 114
114 -
 115
115 -
 116
116 -
 117
117 -
 118
118 -
 119
119 -
 120
120 -
 121
121 -
 122
122 -
 123
123 -
 124
124 -
 125
125 -
 126
126 -
 127
127 -
 128
128 -
 129
129 -
 130
130 -
 131
131 -
 132
132 -
 133
133 -
134
-
135
-
136
-
137
-
138
-
139
-
140
-
141
-
142
-
143
-
144
-
145
-
146
-
147
-
148
-
149
-
150
-
151
-
152
-
153
-
154
-
155
-
156
-
157
-
158
-
159
-
160
-
161
-
162
-
163
-
164
-
165
-
166
-
167
-
168
-
169
-
170
-
171
-
172
 |
 |

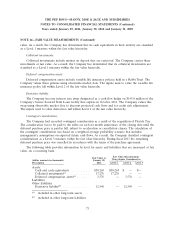
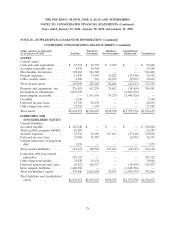
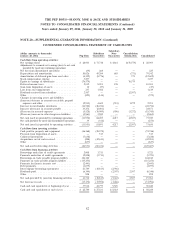
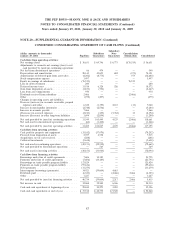
THE PEP BOYS—MANNY, MOE & JACK AND SUBSIDIARIES
NOTES TO CONSOLIDATED FINANCIAL STATEMENTS (Continued)
Years ended January 29, 2011, January 30, 2010 and January 31, 2009
NOTE 20—SUPPLEMENTAL GUARANTOR INFORMATION (Continued)
CONDENSED CONSOLIDATING STATEMENT OF OPERATIONS
(dollar amounts in thousands) Subsidiary Subsidiary Consolidation/
Year ended January 28, 2012 Pep Boys Guarantors Non-Guarantors Elimination Consolidated
Merchandise sales ............. $546,420 $1,096,337 $ — $ — $1,642,757
Service revenue ............... 146,021 274,849 — — 420,870
Other revenue ................ — — 23,355 (23,355) —
Total revenues ................ 692,441 1,371,186 23,355 (23,355) 2,063,627
Costs of merchandise sales ....... 392,065 763,939 — (1,682) 1,154,322
Costs of service revenue ......... 132,635 267,302 — (161) 399,776
Costs of other revenue .......... — — 20,140 (20,140) —
Total costs of revenues .......... 524,700 1,031,241 20,140 (21,983) 1,554,098
Gross profit from merchandise sales 154,355 332,398 — 1,682 488,435
Gross profit from service revenue . . 13,386 7,547 — 161 21,094
Gross profit from other revenue . . . — — 3,215 (3,215) —
Total gross profit .............. 167,741 339,945 3,215 (1,372) 509,529
Selling, general and administrative
expenses ................... 156,184 291,372 329 (3,899) 443,986
Net gain from dispositions of assets . (10) 37 — — 27
Operating profit ............... 11,547 48,610 2,886 2,527 65,570
Non-operating (expenses) income . . (16,492) 64,157 2,528 (47,869) 2,324
Interest expenses (income) ....... 70,685 3,050 (2,087) (45,342) 26,306
(Loss) earnings from continuing
operations before income taxes . . (75,630) 109,717 7,501 — 41,588
Income tax (benefit) expense ..... (27,915) 37,715 2,660 — 12,460
Equity in earnings of subsidiaries . . 76,579 — — (76,579) —
Earnings (loss) from continuing
operations ................. 28,864 72,002 4,841 (76,579) 29,128
Loss from discontinued operations,
net of tax.................. 39 (264) — — (225)
Net earnings (loss) ............. $ 28,903 $ 71,738 $ 4,841 $(76,579) $ 28,903
79