Pep Boys 2011 Annual Report Download - page 72
Download and view the complete annual report
Please find page 72 of the 2011 Pep Boys annual report below. You can navigate through the pages in the report by either clicking on the pages listed below, or by using the keyword search tool below to find specific information within the annual report.-
 1
1 -
2
-
3
-
4
-
5
-
6
-
7
-
8
-
9
-
10
-
11
-
12
-
13
-
14
-
15
-
16
-
17
-
18
-
19
-
20
-
21
-
22
-
23
-
24
-
25
-
26
-
27
-
28
-
29
-
30
-
31
-
32
-
33
-
34
-
35
-
36
-
37
-
38
-
39
-
40
-
41
-
42
-
43
-
44
-
45
-
46
-
47
-
48
-
49
-
50
-
51
-
52
-
53
-
54
-
55
-
56
-
57
-
58
-
59
-
60
-
61
-
 62
62 -
 63
63 -
 64
64 -
 65
65 -
 66
66 -
 67
67 -
 68
68 -
 69
69 -
 70
70 -
 71
71 -
 72
72 -
 73
73 -
 74
74 -
 75
75 -
 76
76 -
 77
77 -
 78
78 -
 79
79 -
 80
80 -
 81
81 -
 82
82 -
83
-
84
-
85
-
86
-
87
-
88
-
89
-
90
-
91
-
92
-
93
-
94
-
95
-
96
-
97
-
98
-
99
-
100
-
101
-
102
-
103
-
104
-
105
-
106
-
107
-
108
-
109
-
110
-
111
-
112
-
113
-
114
-
115
-
116
-
117
-
118
-
119
-
120
-
121
-
122
-
123
-
124
-
125
-
126
-
127
-
128
-
129
-
130
-
131
-
132
-
133
-
134
-
135
-
136
-
137
-
138
-
139
-
140
-
141
-
142
-
143
-
144
-
145
-
146
-
147
-
148
-
149
-
150
-
151
-
152
-
153
-
154
-
155
-
156
-
157
-
158
-
159
-
160
-
161
-
162
-
163
-
164
-
165
-
166
-
167
-
168
-
169
-
170
-
171
-
172
 |
 |

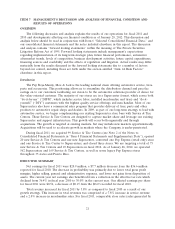
operation in both the Service and Retail areas positively differentiates us from most of our competitors.
Although we manage our performance at a store level in aggregation, we believe that the following
presentation, which includes the reclassification of revenue from merchandise that we install in
customer vehicles to service center revenue, shows an accurate comparison against competitors within
the two sales arenas. We compete in the Retail area of the business through our retail sales floor and
commercial sales business. Our Service Center business competes in the Service area of the industry.
The following table presents the revenues and gross profit for each area of the business.
Fiscal Year ended
January 28, January 29, January 30,
(dollar amounts in thousands) 2012 2011 2010
Service center revenue(1) ................ $1,038,714 $ 941,869 $ 897,630
Retail sales(2) ........................ 1,024,913 1,046,772 1,013,308
Total revenues ....................... $2,063,627 $1,988,641 $1,910,938
Gross profit from service center revenue(3) . . . $ 220,314 $ 216,176 $ 211,056
Gross profit from retail sales(4) ............ 289,213 306,176 275,051
Total gross profit ...................... $ 509,527 $ 522,352 $ 486,107
(1) Includes revenues from installed products.
(2) Excludes revenues from installed products.
(3) Gross profit from service center revenue includes the cost of installed products sold,
buying, warehousing, service center payroll and related employee benefits and service
center occupancy costs. Occupancy costs include utilities, rents, real estate and property
taxes, repairs and maintenance and depreciation and amortization expenses.
(4) Gross profit from retail sales includes the cost of products sold, buying, warehousing and
store occupancy costs. Occupancy costs include utilities, rents, real estate and property
taxes, repairs and maintenance and depreciation and amortization expenses.
CAPITAL & LIQUIDITY
Capital Resources and Needs
Our cash requirements arise principally from (1) the purchase of inventory and capital
expenditures related to existing and new stores, offices and distribution centers, (2) debt service and
(3) contractual obligations. Cash flows realized through the sales of automotive services, tires, parts and
accessories are our primary source of liquidity. Net cash provided by operating activities was
$73.7 million for fiscal 2011, as compared to $117.2 million for fiscal 2010. The $43.5 million decrease
was primarily due to an unfavorable change in operating assets and liabilities of $36.4 million, a
decrease in net earnings net of non-cash adjustments of $8.4 million and a decrease in net cash used in
discontinued operations of $1.2 million. The change in operating assets and liabilities was primarily due
to unfavorable changes in inventory, net of accounts payable of $20.1 million, accrued expenses and
other current assets of $15.0 million and other liabilities of $1.3 million.
In fiscal year 2011, the increased investment in inventory of $42.8 million was principally funded by
increased participation in our trade payable program and improvements in our trade vendor payment
terms. Taking into consideration changes in our trade payable program liability (shown as cash flows
from financing activities on the consolidated statements of cash flows), cash generated from accounts
payable was $53.8 million and $29.7 million for fiscal years 2011 and 2010, respectively. The ratio of
accounts payable, including our trade payable program, to inventory was 53.6% and 47.3% as of
January 28, 2012 and January 29, 2011, respectively. The increase in inventory of $49.7 million since the
28