Pep Boys 2011 Annual Report Download - page 63
Download and view the complete annual report
Please find page 63 of the 2011 Pep Boys annual report below. You can navigate through the pages in the report by either clicking on the pages listed below, or by using the keyword search tool below to find specific information within the annual report.-
 1
1 -
2
-
3
-
4
-
5
-
6
-
7
-
8
-
9
-
10
-
11
-
12
-
13
-
14
-
15
-
16
-
17
-
18
-
19
-
20
-
21
-
22
-
23
-
24
-
25
-
26
-
27
-
28
-
29
-
30
-
31
-
32
-
33
-
34
-
35
-
36
-
37
-
38
-
39
-
40
-
41
-
42
-
43
-
44
-
45
-
46
-
47
-
48
-
49
-
50
-
51
-
52
-
 53
53 -
 54
54 -
 55
55 -
 56
56 -
 57
57 -
 58
58 -
 59
59 -
 60
60 -
 61
61 -
 62
62 -
 63
63 -
 64
64 -
 65
65 -
 66
66 -
 67
67 -
 68
68 -
 69
69 -
 70
70 -
 71
71 -
 72
72 -
 73
73 -
74
-
75
-
76
-
77
-
78
-
79
-
80
-
81
-
82
-
83
-
84
-
85
-
86
-
87
-
88
-
89
-
90
-
91
-
92
-
93
-
94
-
95
-
96
-
97
-
98
-
99
-
100
-
101
-
102
-
103
-
104
-
105
-
106
-
107
-
108
-
109
-
110
-
111
-
112
-
113
-
114
-
115
-
116
-
117
-
118
-
119
-
120
-
121
-
122
-
123
-
124
-
125
-
126
-
127
-
128
-
129
-
130
-
131
-
132
-
133
-
134
-
135
-
136
-
137
-
138
-
139
-
140
-
141
-
142
-
143
-
144
-
145
-
146
-
147
-
148
-
149
-
150
-
151
-
152
-
153
-
154
-
155
-
156
-
157
-
158
-
159
-
160
-
161
-
162
-
163
-
164
-
165
-
166
-
167
-
168
-
169
-
170
-
171
-
172
 |
 |

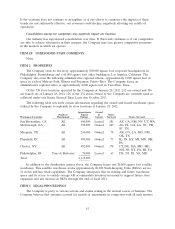
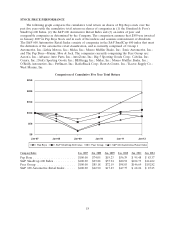
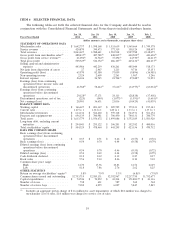
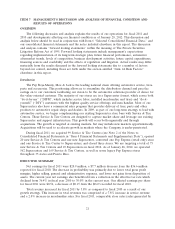
ITEM 6 SELECTED FINANCIAL DATA
The following tables set forth the selected financial data for the Company and should be read in
conjunction with the Consolidated Financial Statements and Notes thereto included elsewhere herein.
Jan. 28, Jan. 29, Jan. 30, Jan. 31, Feb. 2,
Fiscal Year Ended 2012 2011 2010 2009 2008
(dollar amounts are in thousands, except per share data)
STATEMENT OF OPERATIONS DATA
Merchandise sales ................ $1,642,757 $ 1,598,168 $ 1,533,619 $ 1,569,664 $ 1,749,578
Service revenue ................. 420,870 390,473 377,319 358,124 388,497
Total revenues .................. 2,063,627 1,988,641 1,910,938 1,927,788 2,138,075
Gross profit from merchandise sales(8) . . 488,435(1) 487,788(3) 448,815(4) 440,502(5) 443,626(6)
Gross profit from service revenue(8) .... 21,094(1) 34,564(3) 37,292(4) 24,930(5) 42,611(6)
Total gross profit ................ 509,529(1) 522,352(3) 486,107(4) 465,432(5) 486,237(6)
Selling, general and administrative
expenses .................... 443,986 442,239 430,261 485,044 518,373
Net gain from disposition of assets . . . . 27 2,467 1,213 9,716 15,151
Operating profit (loss) ............. 65,570 82,580 57,059 (9,896) (16,985)
Non-operating income ............. 2,324 2,609 2,261 1,967 5,246
Interest expense ................. 26,306 26,745 21,704(7) 27,048(7) 51,293
Earnings (loss) from continuing
operations before income taxes and
discontinued operations .......... 41,588(1) 58,444(3) 37,616(4) (34,977)(5) (63,032)(6)
Earnings (loss) from continuing
operations before discontinued
operations ................... 29,128(2) 37,171 24,113 (28,838) (37,438)
Discontinued operations, net of tax .... (225) (540) (1,077)(4) (1,591)(5) (3,601)(6)
Net earnings (loss) ............... 28,903 36,631 23,036 (30,429) (41,039)
BALANCE SHEET DATA
Working capital ................. $ 166,627 $ 203,367 $ 205,525 $ 179,233 $ 195,343
Current ratio ................... 1.27 to 1 1.36 to 1 1.40 to 1 1.33 to 1 1.35 to 1
Merchandise inventories ........... $ 614,136 $ 564,402 $ 559,118 $ 564,931 $ 561,152
Property and equipment-net ......... $ 696,339 $ 700,981 $ 706,450 $ 740,331 $ 780,779
Total assets .................... $1,633,779 $ 1,556,672 $ 1,499,086 $ 1,552,389 $ 1,583,920
Long-term debt, excluding current
maturities .................... $ 294,043 $ 295,122 $ 306,201 $ 352,382 $ 400,016
Total stockholders’ equity ........... $ 504,329 $ 478,460 $ 443,295 $ 423,156 $ 470,712
DATA PER COMMON SHARE
Basic earnings (loss) from continuing
operations before discontinued
operations ................... $ 0.55 $ 0.71 $ 0.46 $ (0.55) $ (0.72)
Basic earnings (loss) .............. 0.54 0.70 0.44 (0.58) (0.79)
Diluted earnings (loss) from continuing
operations before discontinued
operations ................... 0.54 0.70 0.46 (0.55) (0.72)
Diluted earnings (loss) ............. 0.54 0.69 0.44 (0.58) (0.79)
Cash dividends declared ............ 0.12 0.12 0.12 0.27 0.27
Book value .................... 9.56 9.10 8.46 8.10 9.10
Common share price range:
High ....................... 14.70 15.96 10.83 12.56 22.49
Low . . . . . . . . . . . . . . . . . . . . . . . 8.18 7.86 2.76 2.62 8.25
OTHER STATISTICS
Return on average stockholders’ equity(9) 5.8% 7.9% 5.3% (6.8)% (7.9)%
Common shares issued and outstanding . 52,753,719 52,585,131 52,392,967 52,237,750 51,752,677
Capital expenditures .............. $ 74,746 $ 70,252 $ 43,214 $ 151,883(10) $ 43,116
Number of stores . . . . . . . . . . . . . . . . 738 621 587 562 562
Number of service bays ............ 7,182 6,259 6,027 5,845 5,845
(1) Includes an aggregate pretax charge of $1.6 million for asset impairment, of which $0.6 million was charged to
merchandise cost of sales, $1.0 million was charged to service cost of sales.
19