Pep Boys 2011 Annual Report Download - page 84
Download and view the complete annual report
Please find page 84 of the 2011 Pep Boys annual report below. You can navigate through the pages in the report by either clicking on the pages listed below, or by using the keyword search tool below to find specific information within the annual report.-
 1
1 -
2
-
3
-
4
-
5
-
6
-
7
-
8
-
9
-
10
-
11
-
12
-
13
-
14
-
15
-
16
-
17
-
18
-
19
-
20
-
21
-
22
-
23
-
24
-
25
-
26
-
27
-
28
-
29
-
30
-
31
-
32
-
33
-
34
-
35
-
36
-
37
-
38
-
39
-
40
-
41
-
42
-
43
-
44
-
45
-
46
-
47
-
48
-
49
-
50
-
51
-
52
-
53
-
54
-
55
-
56
-
57
-
58
-
59
-
60
-
61
-
62
-
63
-
64
-
65
-
66
-
67
-
68
-
69
-
70
-
71
-
72
-
73
-
 74
74 -
 75
75 -
 76
76 -
 77
77 -
 78
78 -
 79
79 -
 80
80 -
 81
81 -
 82
82 -
 83
83 -
 84
84 -
 85
85 -
 86
86 -
 87
87 -
 88
88 -
 89
89 -
 90
90 -
 91
91 -
 92
92 -
 93
93 -
 94
94 -
95
-
96
-
97
-
98
-
99
-
100
-
101
-
102
-
103
-
104
-
105
-
106
-
107
-
108
-
109
-
110
-
111
-
112
-
113
-
114
-
115
-
116
-
117
-
118
-
119
-
120
-
121
-
122
-
123
-
124
-
125
-
126
-
127
-
128
-
129
-
130
-
131
-
132
-
133
-
134
-
135
-
136
-
137
-
138
-
139
-
140
-
141
-
142
-
143
-
144
-
145
-
146
-
147
-
148
-
149
-
150
-
151
-
152
-
153
-
154
-
155
-
156
-
157
-
158
-
159
-
160
-
161
-
162
-
163
-
164
-
165
-
166
-
167
-
168
-
169
-
170
-
171
-
172
 |
 |

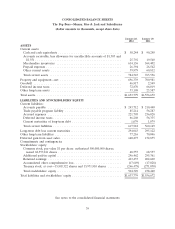
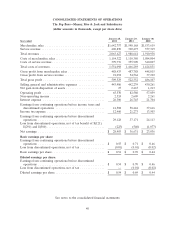
CONSOLIDATED STATEMENTS OF OPERATIONS
The Pep Boys—Manny, Moe & Jack and Subsidiaries
(dollar amounts in thousands, except per share data)
January 28, January 29, January 30,
Year ended 2012 2011 2010
Merchandise sales .................................. $1,642,757 $1,598,168 $1,533,619
Service revenue .................................... 420,870 390,473 377,319
Total revenues ..................................... 2,063,627 1,988,641 1,910,938
Costs of merchandise sales ............................ 1,154,322 1,110,380 1,084,804
Costs of service revenue .............................. 399,776 355,909 340,027
Total costs of revenues ............................... 1,554,098 1,466,289 1,424,831
Gross profit from merchandise sales ..................... 488,435 487,788 448,815
Gross profit from service revenue ....................... 21,094 34,564 37,292
Total gross profit ................................... 509,529 522,352 486,107
Selling, general and administrative expenses ............... 443,986 442,239 430,261
Net gain from disposition of assets . . . . . . . . . . . . . . . . . . . . . . 27 2,467 1,213
Operating profit ................................... 65,570 82,580 57,059
Non-operating income ............................... 2,324 2,609 2,261
Interest expense ................................... 26,306 26,745 21,704
Earnings from continuing operations before income taxes and
discontinued operations ............................ 41,588 58,444 37,616
Income tax expense ................................. 12,460 21,273 13,503
Earnings from continuing operations before discontinued
operations ...................................... 29,128 37,171 24,113
Loss from discontinued operations, net of tax benefit of $(121),
$(291) and $(580) ................................. (225) (540) (1,077)
Net earnings ...................................... $ 28,903 $ 36,631 $ 23,036
Basic earnings per share:
Earnings from continuing operations before discontinued
operations ...................................... $ 0.55 $ 0.71 $ 0.46
Loss from discontinued operations, net of tax .............. (0.01) (0.01) (0.02)
Basic earnings per share .............................. $ 0.54 $ 0.70 $ 0.44
Diluted earnings per share:
Earnings from continuing operations before discontinued
operations ...................................... $ 0.54 $ 0.70 $ 0.46
Loss from discontinued operations, net of tax .............. — (0.01) (0.02)
Diluted earnings per share ............................ $ 0.54 $ 0.69 $ 0.44
See notes to the consolidated financial statements
40