Pep Boys 2011 Annual Report Download - page 153
Download and view the complete annual report
Please find page 153 of the 2011 Pep Boys annual report below. You can navigate through the pages in the report by either clicking on the pages listed below, or by using the keyword search tool below to find specific information within the annual report.-
 1
1 -
2
-
3
-
4
-
5
-
6
-
7
-
8
-
9
-
10
-
11
-
12
-
13
-
14
-
15
-
16
-
17
-
18
-
19
-
20
-
21
-
22
-
23
-
24
-
25
-
26
-
27
-
28
-
29
-
30
-
31
-
32
-
33
-
34
-
35
-
36
-
37
-
38
-
39
-
40
-
41
-
42
-
43
-
44
-
45
-
46
-
47
-
48
-
49
-
50
-
51
-
52
-
53
-
54
-
55
-
56
-
57
-
58
-
59
-
60
-
61
-
62
-
63
-
64
-
65
-
66
-
67
-
68
-
69
-
70
-
71
-
72
-
73
-
74
-
75
-
76
-
77
-
78
-
79
-
80
-
81
-
82
-
83
-
84
-
85
-
86
-
87
-
88
-
89
-
90
-
91
-
92
-
93
-
94
-
95
-
96
-
97
-
98
-
99
-
100
-
101
-
102
-
103
-
104
-
105
-
106
-
107
-
108
-
109
-
110
-
111
-
112
-
113
-
114
-
115
-
116
-
117
-
118
-
119
-
120
-
121
-
122
-
123
-
124
-
125
-
126
-
127
-
128
-
129
-
130
-
131
-
132
-
133
-
134
-
135
-
136
-
137
-
138
-
139
-
140
-
141
-
142
-
 143
143 -
 144
144 -
 145
145 -
 146
146 -
 147
147 -
 148
148 -
 149
149 -
 150
150 -
 151
151 -
 152
152 -
 153
153 -
 154
154 -
 155
155 -
 156
156 -
 157
157 -
 158
158 -
 159
159 -
 160
160 -
 161
161 -
 162
162 -
 163
163 -
164
-
165
-
166
-
167
-
168
-
169
-
170
-
171
-
172
 |
 |

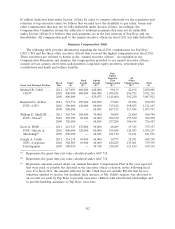
shares of our common stock outstanding as of March 30, 2012 as adjusted pursuant to rules
promulgated by the SEC.
Shares of
Common Stock
# of
Name(2) Shares % of
North Run Capital, LP(3) ............................... 4,050,000 7.7%
North Run GP, LP
North Run Advisors, LLC
Todd B. Hammer
Thomas B. Ellis
One International Place, Suite 2401
Boston, MA 02110
BlackRock, Inc.(4) .................................... 4,444,654 8.4%
40 East 52nd Street
New York, NY 10022
Dimensional Fund Advisors LP(5) ......................... 4,072,323 7.7%
Palisades West, Building One, 6300 Bee Cave Road,
Austin, Texas, 78746
The Vanguard Group, Inc.—23-1945930(6) ................... 2,722,976 5.2%
100 Vanguard Blvd.
Malvern, PA 19355
The Gores Group, LLC(7) .............................. 1,200,000 2.3%
0877 Wilshire Boulevard, 18th Floor
Los Angeles, CA 90024
Directors and Named Executive Officers
James A. Mitarotonda ................................. 1,385,852 2.6%
Michael R. Odell ..................................... 681,195 1.3%
Raymond L. Arthur ................................... 292,747 *
Scott A. Webb ....................................... 160,824 *
Joseph A. Cirelli ..................................... 128,067 *
Nick White ......................................... 95,149 *
William E. Shull III ................................... 84,251 *
Robert H. Hotz ...................................... 76,695 *
James A. Williams .................................... 62,239 *
Jane Scaccetti ....................................... 59,895 *
John T. Sweetwood ................................... 57,028 *
M. Shˆ
an Atkins ...................................... 48,995 *
Irvin D. Reid ....................................... 32,899 *
Directors and Executive Officers as a Group (15) ............. 3,342,668 6.3%
* Less than one percent (1%).
(1) Beneficial ownership is determined in accordance with the rules and regulations of the
SEC. In computing the number of shares beneficially owned by a person and the
percentage of ownership of that person, shares of common stock subject to options,
restricted stock units, performance stock units and deferred stock units held by that
person that are currently exercisable or become exercisable or vest, as applicable, within
109