Pep Boys 2011 Annual Report Download - page 106
Download and view the complete annual report
Please find page 106 of the 2011 Pep Boys annual report below. You can navigate through the pages in the report by either clicking on the pages listed below, or by using the keyword search tool below to find specific information within the annual report.-
 1
1 -
2
-
3
-
4
-
5
-
6
-
7
-
8
-
9
-
10
-
11
-
12
-
13
-
14
-
15
-
16
-
17
-
18
-
19
-
20
-
21
-
22
-
23
-
24
-
25
-
26
-
27
-
28
-
29
-
30
-
31
-
32
-
33
-
34
-
35
-
36
-
37
-
38
-
39
-
40
-
41
-
42
-
43
-
44
-
45
-
46
-
47
-
48
-
49
-
50
-
51
-
52
-
53
-
54
-
55
-
56
-
57
-
58
-
59
-
60
-
61
-
62
-
63
-
64
-
65
-
66
-
67
-
68
-
69
-
70
-
71
-
72
-
73
-
74
-
75
-
76
-
77
-
78
-
79
-
80
-
81
-
82
-
83
-
84
-
85
-
86
-
87
-
88
-
89
-
90
-
91
-
92
-
93
-
94
-
95
-
 96
96 -
 97
97 -
 98
98 -
 99
99 -
 100
100 -
 101
101 -
 102
102 -
 103
103 -
 104
104 -
 105
105 -
 106
106 -
 107
107 -
 108
108 -
 109
109 -
 110
110 -
 111
111 -
 112
112 -
 113
113 -
 114
114 -
 115
115 -
 116
116 -
117
-
118
-
119
-
120
-
121
-
122
-
123
-
124
-
125
-
126
-
127
-
128
-
129
-
130
-
131
-
132
-
133
-
134
-
135
-
136
-
137
-
138
-
139
-
140
-
141
-
142
-
143
-
144
-
145
-
146
-
147
-
148
-
149
-
150
-
151
-
152
-
153
-
154
-
155
-
156
-
157
-
158
-
159
-
160
-
161
-
162
-
163
-
164
-
165
-
166
-
167
-
168
-
169
-
170
-
171
-
172
 |
 |

THE PEP BOYS—MANNY, MOE & JACK AND SUBSIDIARIES
NOTES TO CONSOLIDATED FINANCIAL STATEMENTS (Continued)
Years ended January 29, 2011, January 30, 2010 and January 31, 2009
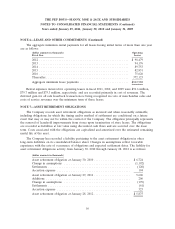
NOTE 11—STORE CLOSURES AND ASSET IMPAIRMENTS (Continued)
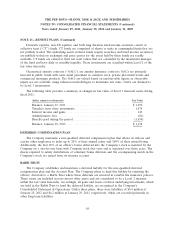
During fiscal 2009, the Company sold four stores classified as held for disposal for $3.6 million and
recorded a net gain of $0.2 million of which $0.1 million is reported in discontinued operations. The
Company also decided to reopen one store and moved the carrying value of $1.7 million to property
and equipment. During fiscal 2009 in response to a continuing weak real estate market, the Company
reduced its prices for certain properties and recorded a $3.1 million impairment charge, of which
$2.2 million was charged to merchandise cost of sales, $0.7 million was charged to service cost of sales
and $0.2 million (pretax) was charged to discontinued operations.
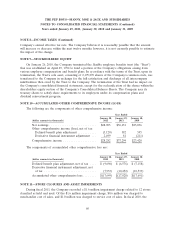
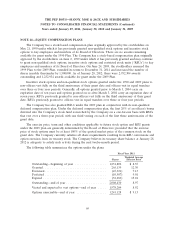
NOTE 12—EARNINGS PER SHARE
Basic earnings per share is based on net earnings divided by the weighted average number of
shares outstanding during the period. The following schedule presents the calculation of basic and
diluted earnings per share for earnings from continuing operations:
Year Ended
January 28, January 29, January 30,
2012 2011 2010
(dollar amounts in thousands, except per share amounts)
(a) Earnings from continuing operations before discontinued
operations .................................... $29,128 $37,171 $24,113
Loss from discontinued operations, net of tax benefit of
$(121), $(291) and $(580) ......................... (225) (540) (1,077)
Net earnings .................................... $28,903 $36,631 $23,036
(b) Basic average number of common shares outstanding during
period ....................................... 52,958 52,677 52,397
Common shares assumed issued upon exercise of dilutive
stock options, net of assumed repurchase, at the average
market price .................................. 673 485 270
(c) Diluted average number of common shares assumed
outstanding during period ......................... 53,631 53,162 52,667
Basic earnings per share:
Earnings from continuing operations (a/b) .............. $ 0.55 $ 0.71 $ 0.46
Discontinued operations, net of tax ................... (0.01) (0.01) (0.02)
Basic earnings per share ........................... $ 0.54 $ 0.70 $ 0.44
Diluted earnings per share:
Earnings from continuing operations (a/c) ............... $ 0.54 $ 0.70 $ 0.46
Discontinued operations, net of tax ................... — (0.01) (0.02)
Diluted earnings per share .......................... $ 0.54 $ 0.69 $ 0.44
Certain stock options were excluded from the calculations of diluted earnings per share because
their exercise prices were greater than the average market price of the common shares for the period
then ended and therefore would be anti-dilutive. The total number of such shares excluded from the
62