Pep Boys 2011 Annual Report Download - page 67
Download and view the complete annual report
Please find page 67 of the 2011 Pep Boys annual report below. You can navigate through the pages in the report by either clicking on the pages listed below, or by using the keyword search tool below to find specific information within the annual report.-
 1
1 -
2
-
3
-
4
-
5
-
6
-
7
-
8
-
9
-
10
-
11
-
12
-
13
-
14
-
15
-
16
-
17
-
18
-
19
-
20
-
21
-
22
-
23
-
24
-
25
-
26
-
27
-
28
-
29
-
30
-
31
-
32
-
33
-
34
-
35
-
36
-
37
-
38
-
39
-
40
-
41
-
42
-
43
-
44
-
45
-
46
-
47
-
48
-
49
-
50
-
51
-
52
-
53
-
54
-
55
-
56
-
 57
57 -
 58
58 -
 59
59 -
 60
60 -
 61
61 -
 62
62 -
 63
63 -
 64
64 -
 65
65 -
 66
66 -
 67
67 -
 68
68 -
 69
69 -
 70
70 -
 71
71 -
 72
72 -
 73
73 -
 74
74 -
 75
75 -
 76
76 -
 77
77 -
78
-
79
-
80
-
81
-
82
-
83
-
84
-
85
-
86
-
87
-
88
-
89
-
90
-
91
-
92
-
93
-
94
-
95
-
96
-
97
-
98
-
99
-
100
-
101
-
102
-
103
-
104
-
105
-
106
-
107
-
108
-
109
-
110
-
111
-
112
-
113
-
114
-
115
-
116
-
117
-
118
-
119
-
120
-
121
-
122
-
123
-
124
-
125
-
126
-
127
-
128
-
129
-
130
-
131
-
132
-
133
-
134
-
135
-
136
-
137
-
138
-
139
-
140
-
141
-
142
-
143
-
144
-
145
-
146
-
147
-
148
-
149
-
150
-
151
-
152
-
153
-
154
-
155
-
156
-
157
-
158
-
159
-
160
-
161
-
162
-
163
-
164
-
165
-
166
-
167
-
168
-
169
-
170
-
171
-
172
 |
 |

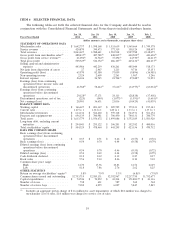
Analysis of Statement of Operations
The following table presents, for the periods indicated, certain items in the consolidated statements
of operations as a percentage of total revenues (except as otherwise provided) and the percentage
change in dollar amounts of such items compared to the indicated prior period.
Percentage of Total Revenues Percentage Change
Jan 28, 2012 Jan 29, 2011 Jan 30, 2010 Fiscal 2011 vs. Fiscal 2010 vs.
Year ended (Fiscal 2011) (Fiscal 2010) (Fiscal 2009) Fiscal 2010 Fiscal 2009
Merchandise sales ............. 79.6% 80.4% 80.3% 2.8% 4.2%
Service revenue(1) ............. 20.4 19.6 19.7 7.8 3.5
Total revenues ............... 100.0 100.0 100.0 3.8 4.1
Costs of merchandise sales(2) ..... 70.3(3) 69.5(3) 70.7(3) (4.0) (2.4)
Costs of service revenue(2) ....... 95.0(3) 91.1(3) 90.1(3) (12.3) (4.7)
Total costs of revenues ......... 75.3 73.7 74.6 (6.0) (2.9)
Gross profit from merchandise
sales ..................... 29.7(3) 30.5(3) 29.3(3) 0.1 8.7
Gross profit from service revenue . 5.0(3) 8.9(3) 9.9(3) (39.0) (7.3)
Total gross profit .............. 24.7 26.3 25.4 (2.5) 7.5
Selling, general and administrative
expenses .................. 21.5 22.2 22.5 (0.4) (2.8)
Net gain from disposition of assets . — 0.1 0.1 (98.9) 103.4
Operating profit (loss) . . . . . . . . . . 3.2 4.2 3.0 (20.6) 44.7
Non-operating income . . . . . . . . . . 0.1 0.1 0.1 (10.9) 15.4
Interest expense . . . . . . . . . . . . . . 1.3 1.3 1.1 1.6 (23.2)
Earnings (loss) from continuing
operations before income taxes . . 2.0 2.9 2.0 (28.8) 55.4
Income tax expense (benefit) ..... 30.0(4) 36.4(4) 35.9(4) 41.4 (57.5)
Earnings (loss) from continuing
operations . . . . . . . . . . . . . . . . . 1.4 1.9 1.3 (21.6) 54.2
Discontinued operations, net of tax — — (0.1) 58.3 49.9
Net earnings (loss) . . . . . . . . . . . . 1.4 1.8 1.2 (21.1) 59.0
(1) Service revenue consists of the labor charge for installing merchandise or maintaining or repairing
vehicles, excluding the sale of any installed parts or materials.
(2) Costs of merchandise sales include the cost of products sold, buying, warehousing and store
occupancy costs. Costs of service revenue include service center payroll and related employee
benefits and service center occupancy costs. Occupancy costs include utilities, rents, real estate and
property taxes, repairs and maintenance and depreciation and amortization expenses.
(3) As a percentage of related sales or revenue, as applicable.
(4) As a percentage of earnings (loss) from continuing operations before income taxes.
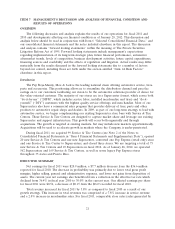
Fiscal 2011 vs. Fiscal 2010
Total revenue for fiscal 2011 increased by 3.8% or $75.0 million to $2,063.6 million from $1,988.6
million in fiscal 2010, while comparable store sales for fiscal 2011 decreased 0.6% as compared to the
prior year. This decrease in comparable store sales consisted of an increase of 0.6% in comparable
store service revenue offset by a decrease of 0.9% in comparable store merchandise sales. Total
comparable store sales decreased due to lower customer counts in all three lines of business partially
23