Pep Boys 2011 Annual Report Download - page 121
Download and view the complete annual report
Please find page 121 of the 2011 Pep Boys annual report below. You can navigate through the pages in the report by either clicking on the pages listed below, or by using the keyword search tool below to find specific information within the annual report.-
 1
1 -
2
-
3
-
4
-
5
-
6
-
7
-
8
-
9
-
10
-
11
-
12
-
13
-
14
-
15
-
16
-
17
-
18
-
19
-
20
-
21
-
22
-
23
-
24
-
25
-
26
-
27
-
28
-
29
-
30
-
31
-
32
-
33
-
34
-
35
-
36
-
37
-
38
-
39
-
40
-
41
-
42
-
43
-
44
-
45
-
46
-
47
-
48
-
49
-
50
-
51
-
52
-
53
-
54
-
55
-
56
-
57
-
58
-
59
-
60
-
61
-
62
-
63
-
64
-
65
-
66
-
67
-
68
-
69
-
70
-
71
-
72
-
73
-
74
-
75
-
76
-
77
-
78
-
79
-
80
-
81
-
82
-
83
-
84
-
85
-
86
-
87
-
88
-
89
-
90
-
91
-
92
-
93
-
94
-
95
-
96
-
97
-
98
-
99
-
100
-
101
-
102
-
103
-
104
-
105
-
106
-
107
-
108
-
109
-
110
-
 111
111 -
 112
112 -
 113
113 -
 114
114 -
 115
115 -
 116
116 -
 117
117 -
 118
118 -
 119
119 -
 120
120 -
 121
121 -
 122
122 -
 123
123 -
 124
124 -
 125
125 -
 126
126 -
 127
127 -
 128
128 -
 129
129 -
 130
130 -
 131
131 -
132
-
133
-
134
-
135
-
136
-
137
-
138
-
139
-
140
-
141
-
142
-
143
-
144
-
145
-
146
-
147
-
148
-
149
-
150
-
151
-
152
-
153
-
154
-
155
-
156
-
157
-
158
-
159
-
160
-
161
-
162
-
163
-
164
-
165
-
166
-
167
-
168
-
169
-
170
-
171
-
172
 |
 |

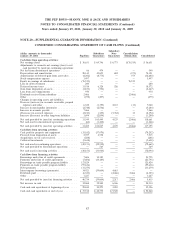
THE PEP BOYS—MANNY, MOE & JACK AND SUBSIDIARIES
NOTES TO CONSOLIDATED FINANCIAL STATEMENTS (Continued)
Years ended January 29, 2011, January 30, 2010 and January 31, 2009
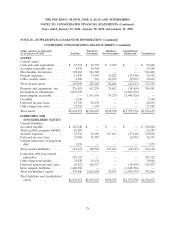
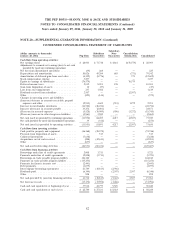
NOTE 20—SUPPLEMENTAL GUARANTOR INFORMATION (Continued)
On May 5, 2011, The Pep Boys—Manny, Moe & Jack acquired Tire Store Group Holdings
Corporation and its subsidiary Big 10 Tire Stores, LLC. As a result of this acquisition, The Pep Boys—
Manny, Moe & Jack of Pennsylvania increased its investment in subsidiaries by $9.4 million (see
Note 2—Acquisitions).
CONDENSED CONSOLIDATING BALANCE SHEET
(dollar amounts in thousands) Subsidiary Subsidiary Consolidation/
As of January 28, 2012 Pep Boys Guarantors Non-Guarantors Elimination Consolidated
ASSETS
Current assets:
Cash and cash equivalents ...... $ 22,740 $ 27,181 $ 8,323 $ — $ 58,244
Accounts receivable, net ........ 14,566 11,226 — — 25,792
Merchandise inventories ........ 214,584 399,552 — — 614,136
Prepaid expenses ............. 12,945 16,873 14,996 (18,420) 26,394
Other current assets . . . . . . . . . . 606 — 64,214 (4,841) 59,979
Total current assets ........... 265,441 454,832 87,533 (23,261) 784,545
Property and equipment—net .... 243,108 441,645 30,177 (18,591) 696,339
Investment in subsidiaries ...... 2,176,992 — — (2,176,992) —
Intercompany receivable ....... — 1,389,910 82,206 (1,472,116) —
Goodwill ................... 2,549 44,368 — — 46,917
Deferred income taxes ......... 20,468 52,402 — — 72,870
Other long-term assets ......... 31,068 2,040 — — 33,108
Total assets ................. $2,739,626 $2,385,197 $199,916 $(3,690,960) $1,633,779
LIABILITIES AND
STOCKHOLDERS’ EQUITY
Current liabilities:
Accounts payable ............. $ 243,712 $ — $ — $ — $ 243,712
Trade payable program liability . . . 85,214 — — — 85,214
Accrued expenses ............ 17,887 55,527 166,711 (18,420) 221,705
Deferred income taxes ......... 29,383 41,666 — (4,841) 66,208
Current maturities of long-term
debt .................... 1,079 — — — 1,079
Total current liabilities ......... 377,275 97,193 166,711 (23,261) 617,918
Long-term debt less current
maturities ................ 294,043 — — — 294,043
Other long-term liability ........ 30,540 46,676 — — 77,216
Deferred gain from asset sales . . . 61,323 97,541 — (18,591) 140,273
Intercompany liabilities ........ 1,472,116 — — (1,472,116) —
Total stockholders’ equity ....... 504,329 2,143,787 33,205 (2,176,992) 504,329
Total liabilities and stockholders’
equity ................... $2,739,626 $2,385,197 $199,916 $(3,690,960) $1,633,779
77