Pep Boys 2011 Annual Report Download - page 110
Download and view the complete annual report
Please find page 110 of the 2011 Pep Boys annual report below. You can navigate through the pages in the report by either clicking on the pages listed below, or by using the keyword search tool below to find specific information within the annual report.-
 1
1 -
2
-
3
-
4
-
5
-
6
-
7
-
8
-
9
-
10
-
11
-
12
-
13
-
14
-
15
-
16
-
17
-
18
-
19
-
20
-
21
-
22
-
23
-
24
-
25
-
26
-
27
-
28
-
29
-
30
-
31
-
32
-
33
-
34
-
35
-
36
-
37
-
38
-
39
-
40
-
41
-
42
-
43
-
44
-
45
-
46
-
47
-
48
-
49
-
50
-
51
-
52
-
53
-
54
-
55
-
56
-
57
-
58
-
59
-
60
-
61
-
62
-
63
-
64
-
65
-
66
-
67
-
68
-
69
-
70
-
71
-
72
-
73
-
74
-
75
-
76
-
77
-
78
-
79
-
80
-
81
-
82
-
83
-
84
-
85
-
86
-
87
-
88
-
89
-
90
-
91
-
92
-
93
-
94
-
95
-
96
-
97
-
98
-
99
-
 100
100 -
 101
101 -
 102
102 -
 103
103 -
 104
104 -
 105
105 -
 106
106 -
 107
107 -
 108
108 -
 109
109 -
 110
110 -
 111
111 -
 112
112 -
 113
113 -
 114
114 -
 115
115 -
 116
116 -
 117
117 -
 118
118 -
 119
119 -
 120
120 -
121
-
122
-
123
-
124
-
125
-
126
-
127
-
128
-
129
-
130
-
131
-
132
-
133
-
134
-
135
-
136
-
137
-
138
-
139
-
140
-
141
-
142
-
143
-
144
-
145
-
146
-
147
-
148
-
149
-
150
-
151
-
152
-
153
-
154
-
155
-
156
-
157
-
158
-
159
-
160
-
161
-
162
-
163
-
164
-
165
-
166
-
167
-
168
-
169
-
170
-
171
-
172
 |
 |

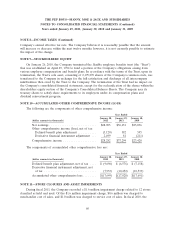
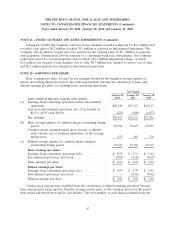
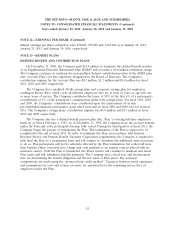
THE PEP BOYS—MANNY, MOE & JACK AND SUBSIDIARIES
NOTES TO CONSOLIDATED FINANCIAL STATEMENTS (Continued)
Years ended January 29, 2011, January 30, 2010 and January 31, 2009
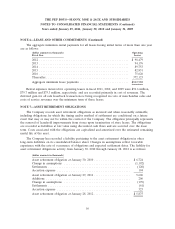
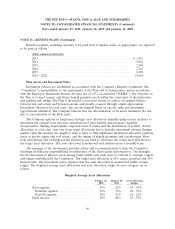
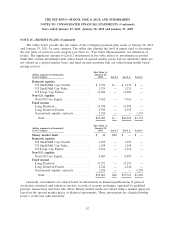
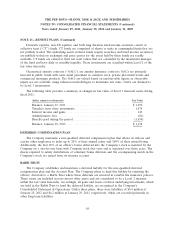
NOTE 13—BENEFIT PLANS (Continued)
Benefit payments, including amounts to be paid from Company assets, as appropriate, are expected
to be paid as follows:
(dollar amounts in thousands)
2013 .................................................... $ 1,987
2014 .................................................... 2,094
2015 .................................................... 2,204
2016 .................................................... 2,326
2017 .................................................... 2,450
2018 - 2022 ............................................... 14,464
Plan Assets and Investment Policy
Investment policies are established in accordance with the Company’s Benefits Committee (the
‘‘Committee’’) responsibilities to the participants of the Plan and its beneficiaries, and in accordance
with the Employee Retirement Income Security Act of 1974, as amended (‘‘ERISA’’). The objective of
the Plan is to meet current and future benefit payment needs within the constraints of diversification
and prudent risk taking. The Plan is diversified across asset classes to achieve an optimal balance
between risk and return and between income and growth of assets through capital appreciation.
Investment objectives for each asset class are determined based on specific risks and investment
opportunities identified. The Company believes that the diversification of its assets minimizes the risk
due to concentration of the Plan assets.
The Company updates its long-term, strategic asset allocations annually using various analytics to
determine the optimal asset mix and consideration of plan liability characteristics, liquidity
characteristics, funding requirements, expected rates of return and the distribution of returns. Actual
allocations to each asset class vary from target allocations due to periodic investment strategy changes,
market value fluctuations, the length of time it takes to fully implement investment allocation positions
(such as private equity and real estate), and the timing of benefit payments and contributions. Short
term investments and exchange-traded derivatives are used to rebalance the actual asset allocation to
the target asset allocation. The asset allocation is monitored and rebalanced on a monthly basis.
The manager of the investments provides advice and recommendations to help the Committee
discharge its fiduciary responsibilities in furtherance of the Plan’s goals and objectives. The manager
has the discretion to allocate assets among funds within each asset class to conform to strategic targets
and ranges established by the Committee. The target asset allocation is 50% equity securities and 50%
fixed income. The investment policy requires that the asset allocation be maintained within certain
ranges. The weighted average asset allocations and asset allocation ranges by asset category are as
follows:
Weighted Average Asset Allocations
January 28, January 29, Asset Allocation
2012 2011 Ranges
Total equities . . . . . . . . . . . . . . . . . . . . . . . . 50% 52% 45 - 55%
Domestic equities . . . . . . . . . . . . . . . . . . . 32% 31% 28 - 38%
Non-US equities . . . . . . . . . . . . . . . . . . . . 18% 21% 12 - 22%
Fixed income . . . . . . . . . . . . . . . . . . . . . . . . 50% 48% 45 - 55%
66