Pep Boys 2011 Annual Report Download - page 78
Download and view the complete annual report
Please find page 78 of the 2011 Pep Boys annual report below. You can navigate through the pages in the report by either clicking on the pages listed below, or by using the keyword search tool below to find specific information within the annual report.-
 1
1 -
2
-
3
-
4
-
5
-
6
-
7
-
8
-
9
-
10
-
11
-
12
-
13
-
14
-
15
-
16
-
17
-
18
-
19
-
20
-
21
-
22
-
23
-
24
-
25
-
26
-
27
-
28
-
29
-
30
-
31
-
32
-
33
-
34
-
35
-
36
-
37
-
38
-
39
-
40
-
41
-
42
-
43
-
44
-
45
-
46
-
47
-
48
-
49
-
50
-
51
-
52
-
53
-
54
-
55
-
56
-
57
-
58
-
59
-
60
-
61
-
62
-
63
-
64
-
65
-
66
-
67
-
 68
68 -
 69
69 -
 70
70 -
 71
71 -
 72
72 -
 73
73 -
 74
74 -
 75
75 -
 76
76 -
 77
77 -
 78
78 -
 79
79 -
 80
80 -
 81
81 -
 82
82 -
 83
83 -
 84
84 -
 85
85 -
 86
86 -
 87
87 -
 88
88 -
89
-
90
-
91
-
92
-
93
-
94
-
95
-
96
-
97
-
98
-
99
-
100
-
101
-
102
-
103
-
104
-
105
-
106
-
107
-
108
-
109
-
110
-
111
-
112
-
113
-
114
-
115
-
116
-
117
-
118
-
119
-
120
-
121
-
122
-
123
-
124
-
125
-
126
-
127
-
128
-
129
-
130
-
131
-
132
-
133
-
134
-
135
-
136
-
137
-
138
-
139
-
140
-
141
-
142
-
143
-
144
-
145
-
146
-
147
-
148
-
149
-
150
-
151
-
152
-
153
-
154
-
155
-
156
-
157
-
158
-
159
-
160
-
161
-
162
-
163
-
164
-
165
-
166
-
167
-
168
-
169
-
170
-
171
-
172
 |
 |

followed in the insurance industry and our historical claims experience. The amounts included in
our costs related to these arrangements are estimated and can vary based on changes in
assumptions, claims experience or the providers included in the associated insurance programs.
A 10% change in our self-insurance liabilities at January 28, 2012 would have affected net
earnings by approximately $5.0 million for fiscal 2011.
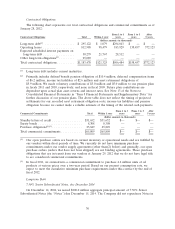
• We have significant pension costs and liabilities that are developed from actuarial valuations.
Inherent in these valuations are key assumptions including discount rates, expected return on
plan assets and mortality rates. We are required to consider current market conditions, including
changes in interest rates, in selecting these assumptions. Changes in the related pension costs or
liabilities may occur in the future due to changes in the assumptions. The following table
highlights the sensitivity of our pension obligation and expense to changes in these assumptions,
assuming all other assumptions remain constant:
Impact on Annual Impact on Projected
Change in Assumption (dollars in thousands) Pension Expense Benefit Obligation
0.50 percentage point decrease in discount rate . . Increase $413 Increase $3,425
0.50 percentage point increase in discount rate . . Decrease $413 Decrease $3,425
5.00 percentage point decrease in expected rate
of return on assets ..................... Increase $148 —
5.00 percentage point increase in expected rate
of return on assets ..................... Decrease $148 —
• We periodically evaluate our long-lived assets for indicators of impairment. Management’s
judgments, including judgments related to store cash flows, are based on market and operating
conditions at the time of evaluation. Future events could cause management’s conclusion on
impairment to change, requiring an adjustment of these assets to their then current fair market
value.
• We have a share-based compensation plan, which includes stock options and restricted stock
units, or RSUs. We account for our share-based compensation plans on a fair value basis. We
determine the fair value of our stock options at the date of the grant using the Black-Scholes
option-pricing model. The RSUs are awarded at a price equal to the market price of our
underlying stock on the date of the grant. In situations where we have granted stock options and
RSUs with market conditions, we have used Monte Carlo simulations in estimating the fair value
of the award. The pricing model and generally accepted valuation techniques require
management to make assumptions and to apply judgment to determine the fair value of our
awards. These assumptions and judgments include the expected life of stock options, expected
stock price volatility, future employee stock option exercise behaviors and the estimate of award
forfeitures. We do not believe there is a reasonable likelihood that there will be a material
change in the future estimates or assumptions we use to determine stock-based compensation
expense. However, if actual results are different from these assumptions, the share-based
compensation expense reported in our financial statements may not be representative of the
actual economic cost of the share-based compensation. In addition, significant changes in these
assumptions could materially impact our share-based compensation expense on future awards. A
10% change in our share-based compensation expense for fiscal 2011 would have affected net
earnings by approximately $0.2 million.
• We are required to estimate our income taxes in each of the jurisdictions in which we operate.
This requires us to estimate our actual current tax exposure together with assessing temporary
differences resulting from differing treatment of items, such as depreciation of property and
equipment and valuation of inventories, for tax and accounting purposes. We determine our
provision for income taxes based on federal and state tax laws and regulations currently in
34