Pep Boys 2011 Annual Report Download - page 88
Download and view the complete annual report
Please find page 88 of the 2011 Pep Boys annual report below. You can navigate through the pages in the report by either clicking on the pages listed below, or by using the keyword search tool below to find specific information within the annual report.-
 1
1 -
2
-
3
-
4
-
5
-
6
-
7
-
8
-
9
-
10
-
11
-
12
-
13
-
14
-
15
-
16
-
17
-
18
-
19
-
20
-
21
-
22
-
23
-
24
-
25
-
26
-
27
-
28
-
29
-
30
-
31
-
32
-
33
-
34
-
35
-
36
-
37
-
38
-
39
-
40
-
41
-
42
-
43
-
44
-
45
-
46
-
47
-
48
-
49
-
50
-
51
-
52
-
53
-
54
-
55
-
56
-
57
-
58
-
59
-
60
-
61
-
62
-
63
-
64
-
65
-
66
-
67
-
68
-
69
-
70
-
71
-
72
-
73
-
74
-
75
-
76
-
77
-
 78
78 -
 79
79 -
 80
80 -
 81
81 -
 82
82 -
 83
83 -
 84
84 -
 85
85 -
 86
86 -
 87
87 -
 88
88 -
 89
89 -
 90
90 -
 91
91 -
 92
92 -
 93
93 -
 94
94 -
 95
95 -
 96
96 -
 97
97 -
 98
98 -
99
-
100
-
101
-
102
-
103
-
104
-
105
-
106
-
107
-
108
-
109
-
110
-
111
-
112
-
113
-
114
-
115
-
116
-
117
-
118
-
119
-
120
-
121
-
122
-
123
-
124
-
125
-
126
-
127
-
128
-
129
-
130
-
131
-
132
-
133
-
134
-
135
-
136
-
137
-
138
-
139
-
140
-
141
-
142
-
143
-
144
-
145
-
146
-
147
-
148
-
149
-
150
-
151
-
152
-
153
-
154
-
155
-
156
-
157
-
158
-
159
-
160
-
161
-
162
-
163
-
164
-
165
-
166
-
167
-
168
-
169
-
170
-
171
-
172
 |
 |

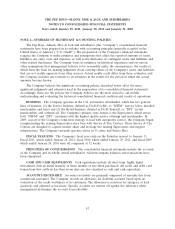
THE PEP BOYS—MANNY, MOE & JACK AND SUBSIDIARIES
NOTES TO CONSOLIDATED FINANCIAL STATEMENTS (Continued)
Years ended January 29, 2011, January 30, 2010 and January 31, 2009
NOTE 1—SUMMARY OF SIGNIFICANT ACCOUNTING POLICIES (Continued)
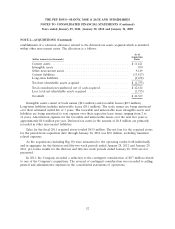
MERCHANDISE INVENTORIES Merchandise inventories are valued at the lower of cost or
market. Cost is determined by using the last-in, first-out (LIFO) method. If the first-in, first-out (FIFO)
method of costing inventory had been used by the Company, inventory would have been $536.4 million
and $486.0 million as of January 28, 2012 and January 29, 2011, respectively. During fiscal 2011, 2010
and 2009, the effect of LIFO layer liquidations on gross profit was immaterial.
The Company’s inventory consists primarily of automotive parts and accessories. Because of the
relatively long lives of vehicles, along with the Company’s historical experience of returning excess
inventory to the Company’s vendors for full credit, the risk of obsolescence is minimal. The Company
establishes a reserve for excess inventory for instances where less than full credit will be received for
such returns and where the Company anticipates items will be sold at retail prices that are less than
recorded costs. The reserve is based on management’s judgment, including estimates and assumptions
regarding marketability of products, the market value of inventory to be sold in future periods and on
historical experiences where the Company received less than full credit from vendors for product
returns.
The Company’s reserve for excess inventory was $4.2 million and $5.4 million as of January 28,
2012 and January 29, 2011, respectively. In fiscal 2010, the Company reduced its reserve for excess
inventory by $5.9 million to $5.4 million from $11.3 million primarily due to improved inventory
management, including timely return of excess product to vendors for credit. However, in future
periods the company may be exposed to material losses should the company’s vendors alter their policy
with regard to accepting excess inventory returns.
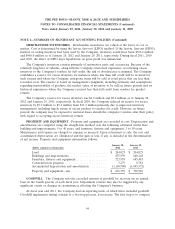
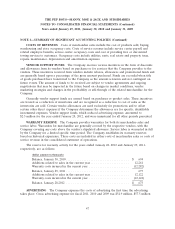
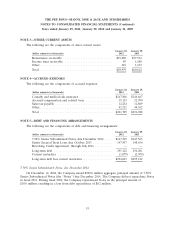
PROPERTY AND EQUIPMENT Property and equipment are recorded at cost. Depreciation and
amortization are computed using the straight-line method over the following estimated useful lives:
building and improvements, 5 to 40 years, and furniture, fixtures and equipment, 3 to 10 years.
Maintenance and repairs are charged to expense as incurred. Upon retirement or sale, the cost and
accumulated depreciation are eliminated and the gain or loss, if any, is included in the determination
of net income. Property and equipment information follows:
January 28, January 29,
(dollar amounts in thousands) 2012 2011
Land ...................................... $ 204,023 $ 204,023
Buildings and improvements ...................... 875,999 848,268
Furniture, fixtures and equipment .................. 723,938 685,481
Construction in progress ........................ 3,279 8,781
Accumulated depreciation and amortization .......... (1,110,900) (1,045,572)
Property and equipment—net ..................... $ 696,339 $ 700,981
GOODWILL The Company tests the recorded amount of goodwill for recovery on an annual
basis in the fourth quarter of each fiscal year. Impairment reviews may also be triggered by any
significant events or changes in circumstances affecting the Company’s business.
At fiscal year end 2011, the Company had six reporting units, of which three included goodwill.
Goodwill impairment testing consists of a two-step process, if necessary. The first step is to compare
44