Pep Boys 2011 Annual Report Download - page 71
Download and view the complete annual report
Please find page 71 of the 2011 Pep Boys annual report below. You can navigate through the pages in the report by either clicking on the pages listed below, or by using the keyword search tool below to find specific information within the annual report.-
 1
1 -
2
-
3
-
4
-
5
-
6
-
7
-
8
-
9
-
10
-
11
-
12
-
13
-
14
-
15
-
16
-
17
-
18
-
19
-
20
-
21
-
22
-
23
-
24
-
25
-
26
-
27
-
28
-
29
-
30
-
31
-
32
-
33
-
34
-
35
-
36
-
37
-
38
-
39
-
40
-
41
-
42
-
43
-
44
-
45
-
46
-
47
-
48
-
49
-
50
-
51
-
52
-
53
-
54
-
55
-
56
-
57
-
58
-
59
-
60
-
 61
61 -
 62
62 -
 63
63 -
 64
64 -
 65
65 -
 66
66 -
 67
67 -
 68
68 -
 69
69 -
 70
70 -
 71
71 -
 72
72 -
 73
73 -
 74
74 -
 75
75 -
 76
76 -
 77
77 -
 78
78 -
 79
79 -
 80
80 -
 81
81 -
82
-
83
-
84
-
85
-
86
-
87
-
88
-
89
-
90
-
91
-
92
-
93
-
94
-
95
-
96
-
97
-
98
-
99
-
100
-
101
-
102
-
103
-
104
-
105
-
106
-
107
-
108
-
109
-
110
-
111
-
112
-
113
-
114
-
115
-
116
-
117
-
118
-
119
-
120
-
121
-
122
-
123
-
124
-
125
-
126
-
127
-
128
-
129
-
130
-
131
-
132
-
133
-
134
-
135
-
136
-
137
-
138
-
139
-
140
-
141
-
142
-
143
-
144
-
145
-
146
-
147
-
148
-
149
-
150
-
151
-
152
-
153
-
154
-
155
-
156
-
157
-
158
-
159
-
160
-
161
-
162
-
163
-
164
-
165
-
166
-
167
-
168
-
169
-
170
-
171
-
172
 |
 |
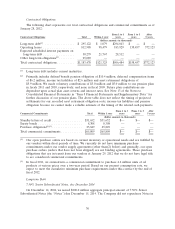
Gross profit from service revenue decreased by $2.7 million, or 7.3%, to $34.6 million in fiscal
2010 from $37.3 million in the prior year. Gross profit margin from service revenue decreased to 8.9%
for fiscal 2010 from 9.9% for fiscal 2009. Gross profit from service revenue for fiscal 2010 included a
$0.2 million asset impairment charge related to previously closed stores. Gross profit from service
revenue for fiscal 2009 included a $0.7 million asset impairment charge related to previously closed
stores. Excluding these items from both years, gross profit margin from service revenue decreased to
8.9% for fiscal 2010 from 10.1% in the prior year. The decrease in gross profit from service revenue
was due to the opening of new Service & Tire Centers, which while in their ramp up stage for sales
incur their full amount of fixed expenses, including payroll and occupancy costs (rent, utilities and
building maintenance). Our new Service & Tire Centers negatively impacted gross margins by 134 basis
points in fiscal 2010. Excluding the impact of new Service & Tire Centers and the impairment charges
described above, gross profit from service revenue increased to 10.7% for fiscal 2010 from 10.5% for
fiscal 2009. The increase in gross profit, exclusive of new locations, was primarily due to increased
service revenues which better leveraged fixed store occupancy costs and, to a lesser extent, labor costs.
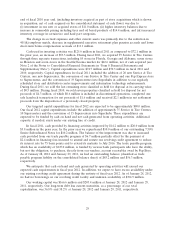
Selling, general and administrative expenses as a percentage of revenue decreased to 22.2% in
fiscal 2010 from 22.5% in fiscal 2009. Selling, general and administrative expenses increased $12.0
million, or 2.8%, to $442.2 million. The increase was primarily due to higher payroll and related
expenses of $5.6 million, higher media expense of $4.9 million and increased travel costs of $1.4
million. The reduction as a percentage of sales reflects improved leverage of selling, general and
administrative expenses achieved through increased sales in fiscal 2010.
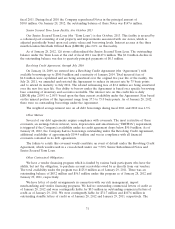
Net gains from the disposition of assets increased by $1.3 million to $2.5 million in fiscal 2010
from $1.2 million in fiscal 2009. Fiscal 2010 includes $2.1 million in net settlement proceeds from the
disposition of a previously closed property, while fiscal 2009 reflects an aggregate gain of $1.3 million
from three store sale and leaseback transactions.
Interest expense for fiscal 2010 was $26.7 million, an increase of $5.0 million, compared to $21.7
million in fiscal 2009. Interest expense for fiscal 2009 included a $6.2 million gain from the retirement
of debt. Excluding this item, interest expense decreased by $1.2 million in fiscal 2010 compared to fiscal
2009 primarily due to reduced debt levels.
Income tax expense for fiscal 2010 was $21.3 million, or an effective rate of 36.4%, as compared to
$13.5 million, or an effective rate of 35.9%, for fiscal 2009. The fiscal 2010 effective tax rate includes a
$2.1 million benefit related to the reduction of a valuation allowance on certain state net operating
losses and credits. The fiscal 2009 effective tax rate includes a $1.2 million benefit due to the allocation
of additional costs to certain jurisdictions thereby reducing past and future tax liabilities.
As a result of the foregoing, we reported net earnings of $36.6 million for fiscal 2010, an increase
of $13.6 million, or 59%, as compared to net earnings of $23.0 million for fiscal 2009. Our diluted
earnings per share were $0.69 for fiscal 2010 as compared to $0.44 for fiscal 2009.
Discontinued Operations
The analysis of our results of continuing operations excludes the operating results of closed stores,
where the customer base could not be maintained, which have been classified as discontinued
operations for all periods presented.
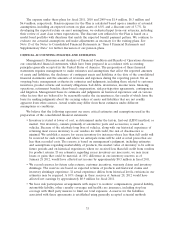
Industry Comparison
We operate in the U.S. automotive aftermarket, which has two general lines of business: (1) the
Service business, defined as Do-It-For-Me (service labor, installed merchandise and tires) and (2) the
Retail business, defined as Do-It-Yourself (retail merchandise) and commercial. Generally, specialized
automotive retailers focus on either the Service or Retail area of the business. We believe that
27