Pep Boys 2011 Annual Report Download - page 105
Download and view the complete annual report
Please find page 105 of the 2011 Pep Boys annual report below. You can navigate through the pages in the report by either clicking on the pages listed below, or by using the keyword search tool below to find specific information within the annual report.-
 1
1 -
2
-
3
-
4
-
5
-
6
-
7
-
8
-
9
-
10
-
11
-
12
-
13
-
14
-
15
-
16
-
17
-
18
-
19
-
20
-
21
-
22
-
23
-
24
-
25
-
26
-
27
-
28
-
29
-
30
-
31
-
32
-
33
-
34
-
35
-
36
-
37
-
38
-
39
-
40
-
41
-
42
-
43
-
44
-
45
-
46
-
47
-
48
-
49
-
50
-
51
-
52
-
53
-
54
-
55
-
56
-
57
-
58
-
59
-
60
-
61
-
62
-
63
-
64
-
65
-
66
-
67
-
68
-
69
-
70
-
71
-
72
-
73
-
74
-
75
-
76
-
77
-
78
-
79
-
80
-
81
-
82
-
83
-
84
-
85
-
86
-
87
-
88
-
89
-
90
-
91
-
92
-
93
-
94
-
 95
95 -
 96
96 -
 97
97 -
 98
98 -
 99
99 -
 100
100 -
 101
101 -
 102
102 -
 103
103 -
 104
104 -
 105
105 -
 106
106 -
 107
107 -
 108
108 -
 109
109 -
 110
110 -
 111
111 -
 112
112 -
 113
113 -
 114
114 -
 115
115 -
116
-
117
-
118
-
119
-
120
-
121
-
122
-
123
-
124
-
125
-
126
-
127
-
128
-
129
-
130
-
131
-
132
-
133
-
134
-
135
-
136
-
137
-
138
-
139
-
140
-
141
-
142
-
143
-
144
-
145
-
146
-
147
-
148
-
149
-
150
-
151
-
152
-
153
-
154
-
155
-
156
-
157
-
158
-
159
-
160
-
161
-
162
-
163
-
164
-
165
-
166
-
167
-
168
-
169
-
170
-
171
-
172
 |
 |

THE PEP BOYS—MANNY, MOE & JACK AND SUBSIDIARIES
NOTES TO CONSOLIDATED FINANCIAL STATEMENTS (Continued)
Years ended January 29, 2011, January 30, 2010 and January 31, 2009
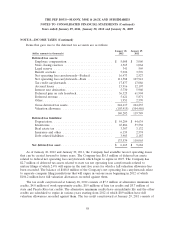
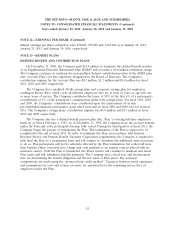
NOTE 11—STORE CLOSURES AND ASSET IMPAIRMENTS (Continued)
Company recorded a $0.8 million impairment charge related to two stores classified as held and used.
Of the $0.8 million impairment charge, $0.6 million was charged to merchandise cost of sales, and
$0.2 million was charged to service cost of sales. In both years the Company used a probability-
weighted approach and estimates of expected future cash flows to determine the fair value of these
stores. Discount and growth rate assumptions were derived from current economic conditions,
management’s expectations and projected trends of current operating results. The fair market value
estimates are classified as a Level 3 measure within the fair value hierarchy. The remaining fair value
of impaired assets was $1.4 million at January 28, 2012.
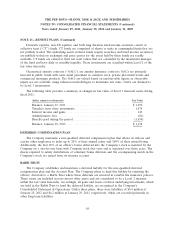
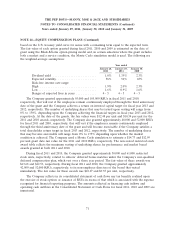
The following schedule details activity in the reserve for closed locations for the three years in the
period ended January 28, 2012. The reserve balance includes remaining rent on leases net of sublease
income.
(dollar amounts in thousands)
Balance, January 31, 2009 .................................... $2,112
Accretion of present value of liabilities . . . . . . . . . . . . . . . . . . . . . . . . . . . 111
Change in assumptions about future sublease income, lease termination . . . 1,122
Cash payments ............................................ (1,095)
Balance, January 30, 2010 .................................... 2,250
Accretion of present value of liabilities . . . . . . . . . . . . . . . . . . . . . . . . . . . 81
Change in assumptions about future sublease income, lease termination . . . 163
Cash payments ............................................ (1,253)
Balance, January 29, 2011 .................................... 1,241
Accretion of present value of liabilities . . . . . . . . . . . . . . . . . . . . . . . . . . . 53
Provision for closed locations . . . . . . . . . . . . . . . . . . . . . . . . . . . . . . . . . . 310
Change in assumptions about future sublease income, lease termination . . . 674
Cash payments ............................................ (477)
Balance, January 28, 2012 .................................... $1,801
A store is classified as ‘‘held for disposal’’ when (i) the Company has committed to a plan to sell,
(ii) the building is vacant and the property is available for sale, (iii) the Company is actively marketing
the property for sale, (iv) the sale price is reasonable in relation to its current fair value and (v) the
Company expects to complete the sale within one year. Assets held for disposal have been valued at
the lower of their carrying amount or their estimated fair value, net of disposal costs. The fair value of
these assets is estimated using readily available market data for comparable properties and is classified
as a Level 2 (as described in Note 16, ‘‘Fair Value Measurements’’) measure within the fair value
hierarchy. No depreciation expense is recognized during the period the asset is held for disposal.
During fiscal 2011, the Company sold the last remaining store classified as an asset held for sale at the
property’s carrying value.
During fiscal 2010, the Company sold seven stores classified as held for disposal for $4.3 million
and recorded a net gain of $0.5 million in earnings from continuing operations. In addition, during
fiscal 2010, the Company recorded a $0.2 million impairment charge related to a store classified as held
for disposal. The Company lowered its selling price reflecting declines in the commercial real estate
market. Substantially all of this impairment was charged to merchandise cost of sales.
61