Pep Boys 2011 Annual Report Download - page 85
Download and view the complete annual report
Please find page 85 of the 2011 Pep Boys annual report below. You can navigate through the pages in the report by either clicking on the pages listed below, or by using the keyword search tool below to find specific information within the annual report.-
 1
1 -
2
-
3
-
4
-
5
-
6
-
7
-
8
-
9
-
10
-
11
-
12
-
13
-
14
-
15
-
16
-
17
-
18
-
19
-
20
-
21
-
22
-
23
-
24
-
25
-
26
-
27
-
28
-
29
-
30
-
31
-
32
-
33
-
34
-
35
-
36
-
37
-
38
-
39
-
40
-
41
-
42
-
43
-
44
-
45
-
46
-
47
-
48
-
49
-
50
-
51
-
52
-
53
-
54
-
55
-
56
-
57
-
58
-
59
-
60
-
61
-
62
-
63
-
64
-
65
-
66
-
67
-
68
-
69
-
70
-
71
-
72
-
73
-
74
-
 75
75 -
 76
76 -
 77
77 -
 78
78 -
 79
79 -
 80
80 -
 81
81 -
 82
82 -
 83
83 -
 84
84 -
 85
85 -
 86
86 -
 87
87 -
 88
88 -
 89
89 -
 90
90 -
 91
91 -
 92
92 -
 93
93 -
 94
94 -
 95
95 -
96
-
97
-
98
-
99
-
100
-
101
-
102
-
103
-
104
-
105
-
106
-
107
-
108
-
109
-
110
-
111
-
112
-
113
-
114
-
115
-
116
-
117
-
118
-
119
-
120
-
121
-
122
-
123
-
124
-
125
-
126
-
127
-
128
-
129
-
130
-
131
-
132
-
133
-
134
-
135
-
136
-
137
-
138
-
139
-
140
-
141
-
142
-
143
-
144
-
145
-
146
-
147
-
148
-
149
-
150
-
151
-
152
-
153
-
154
-
155
-
156
-
157
-
158
-
159
-
160
-
161
-
162
-
163
-
164
-
165
-
166
-
167
-
168
-
169
-
170
-
171
-
172
 |
 |

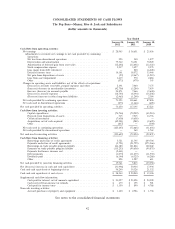
CONSOLIDATED STATEMENTS OF STOCKHOLDERS’ EQUITY
The Pep Boys—Manny, Moe & Jack and Subsidiaries
(dollar amounts in thousands, except share data)
Accumulated
Additional Other Total
Common Stock Treasury Stock
Paid-in Retained Comprehensive Benefit Stockholders’
Shares Amount Capital Earnings Shares Amount Loss Trust Equity
Balance, January 31, 2009 ...... 68,557,041 68,557 292,728 358,670 (14,124,021) (219,460) (18,075) (59,264) 423,156
Comprehensive income:
Net earnings ............ 23,036 23,036
Changes in net unrecognized
other postretirement benefit
costs, net of tax of $352 .... 595 595
Fair market value adjustment on
derivatives, net of tax of ($125) (211) (211)
Total comprehensive income .... 23,420
Cash dividends ($.12 per share) . . (6,286) (6,286)
Reclassification of Benefits Trust . . (2,195,270) (59,264) 59,264 —
Effect of stock options and related
tax benefits ............. (209) 22,000 355 146
Effect of restricted stock unit
conversions ............. (1,493) 81,726 1,321 (172)
Stock compensation expense .... 2,575 2,575
Dividend reinvestment plan ..... (375) 51,491 831 456
Balance, January 30, 2010 ...... 68,557,041 68,557 293,810 374,836 (16,164,074) (276,217) (17,691) — 443,295
Comprehensive income:
Net earnings ............ 36,631 36,631
Changes in net unrecognized
other postretirement benefit
costs, net of tax of $344 .... 582 582
Fair market value adjustment on
derivatives, net of tax of $48 . . 81 81
Total comprehensive income .... 37,294
Cash dividends ($.12 per share) . . (6,323) (6,323)
Effect of stock options and related
tax benefits ............. (2,023) 96,590 2,608 585
Effect of restricted stock unit
conversions ............. (1,946) 61,042 1,647 (299)
Stock compensation expense .... 3,497 3,497
Dividend reinvestment plan ..... (521) 34,532 932 411
Balance, January 29, 2011 ...... 68,557,041 $68,557 $295,361 $402,600 (15,971,910) $(271,030) $(17,028) $ — $478,460
Comprehensive income:
Net earnings ............ 28,903 28,903
Changes in net unrecognized
other postretirement benefit
costs, net of tax of $(1,872) . . (3,120) (3,120)
Fair market value adjustment on
derivatives, net of tax of $1,499 2,499 2,499
Total comprehensive income .... 28,282
Cash dividends ($.12 per share) . . (6,344) (6,344)
Effect of stock options and related
tax benefits ............. (900) 45,321 1,223 323
Effect of employee stock purchase
plan ................. (335) 20,963 566 231
Effect of restricted stock unit
conversions ............. (2,136) 70,228 1,897 (239)
Stock compensation expense .... 3,237 3,237
Dividend reinvestment plan ..... (487) 32,076 866 379
Balance, January 28, 2012 ...... 68,557,041 $68,557 $296,462 $423,437 (15,803,322) $(266,478) $(17,649) $ — $504,329
See notes to the consolidated financial statements
41