Pep Boys 2011 Annual Report Download - page 109
Download and view the complete annual report
Please find page 109 of the 2011 Pep Boys annual report below. You can navigate through the pages in the report by either clicking on the pages listed below, or by using the keyword search tool below to find specific information within the annual report.-
 1
1 -
2
-
3
-
4
-
5
-
6
-
7
-
8
-
9
-
10
-
11
-
12
-
13
-
14
-
15
-
16
-
17
-
18
-
19
-
20
-
21
-
22
-
23
-
24
-
25
-
26
-
27
-
28
-
29
-
30
-
31
-
32
-
33
-
34
-
35
-
36
-
37
-
38
-
39
-
40
-
41
-
42
-
43
-
44
-
45
-
46
-
47
-
48
-
49
-
50
-
51
-
52
-
53
-
54
-
55
-
56
-
57
-
58
-
59
-
60
-
61
-
62
-
63
-
64
-
65
-
66
-
67
-
68
-
69
-
70
-
71
-
72
-
73
-
74
-
75
-
76
-
77
-
78
-
79
-
80
-
81
-
82
-
83
-
84
-
85
-
86
-
87
-
88
-
89
-
90
-
91
-
92
-
93
-
94
-
95
-
96
-
97
-
98
-
 99
99 -
 100
100 -
 101
101 -
 102
102 -
 103
103 -
 104
104 -
 105
105 -
 106
106 -
 107
107 -
 108
108 -
 109
109 -
 110
110 -
 111
111 -
 112
112 -
 113
113 -
 114
114 -
 115
115 -
 116
116 -
 117
117 -
 118
118 -
 119
119 -
120
-
121
-
122
-
123
-
124
-
125
-
126
-
127
-
128
-
129
-
130
-
131
-
132
-
133
-
134
-
135
-
136
-
137
-
138
-
139
-
140
-
141
-
142
-
143
-
144
-
145
-
146
-
147
-
148
-
149
-
150
-
151
-
152
-
153
-
154
-
155
-
156
-
157
-
158
-
159
-
160
-
161
-
162
-
163
-
164
-
165
-
166
-
167
-
168
-
169
-
170
-
171
-
172
 |
 |

THE PEP BOYS—MANNY, MOE & JACK AND SUBSIDIARIES
NOTES TO CONSOLIDATED FINANCIAL STATEMENTS (Continued)
Years ended January 29, 2011, January 30, 2010 and January 31, 2009
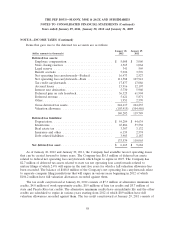
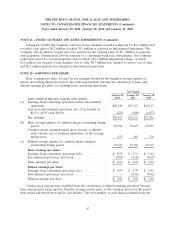
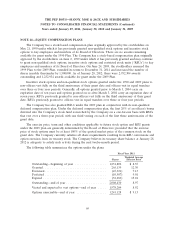
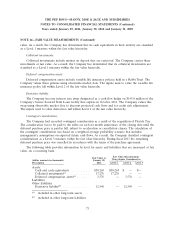
NOTE 13—BENEFIT PLANS (Continued)
The following table sets forth the reconciliation of the benefit obligation, fair value of plan assets
and funded status of the Company’s defined benefit plans:
Year ended
January 28, January 29,
(dollar amounts in thousands) 2012 2011
Change in benefit obligation:
Benefit obligation at beginning of year ................. $46,118 $42,744
Interest cost .................................... 2,558 2,561
Actuarial loss ................................... 6,952 2,454
Benefits paid ................................... (1,654) (1,641)
Benefit obligation at end of year ..................... $53,974 $46,118
Change in plan assets:
Fair value of plan assets at beginning of year ............ $39,063 $31,857
Actual return on plan assets (net of expenses) ........... 3,193 3,847
Employer contributions ............................ 3,000 5,000
Benefits paid ................................... (1,654) (1,641)
Fair value of plan assets at end of year ................ $43,602 $39,063
Unfunded status at fiscal year end ................... $(10,372) $ (7,055)
Net amounts recognized on consolidated balance sheet at
fiscal year end
Noncurrent benefit liability (included in other long-term
liabilities) .................................... $(10,372) $(7,055)
Net amount recognized at fiscal year end ............... $(10,372) $(7,055)
Amounts recognized in accumulated other comprehensive
income (pre-tax) at fiscal year end
Actuarial loss ................................... $15,407 $10,402
Prior service cost ................................ 26 40
Net amount recognized at fiscal year end ............... $15,433 $10,442
Other comprehensive (income) loss attributable to change in
pension liability recognition ....................... $ 4,991 $ (928)
Accumulated benefit obligation at fiscal year end ......... $53,974 $46,118
Other information
Employer contributions expected in fiscal 2012 ........... $ — $ —
Estimated actuarial loss and prior service cost amortization
in fiscal 2012 .................................. $ 2,300 $ 1,530
65