Pep Boys 2011 Annual Report Download - page 86
Download and view the complete annual report
Please find page 86 of the 2011 Pep Boys annual report below. You can navigate through the pages in the report by either clicking on the pages listed below, or by using the keyword search tool below to find specific information within the annual report.-
 1
1 -
2
-
3
-
4
-
5
-
6
-
7
-
8
-
9
-
10
-
11
-
12
-
13
-
14
-
15
-
16
-
17
-
18
-
19
-
20
-
21
-
22
-
23
-
24
-
25
-
26
-
27
-
28
-
29
-
30
-
31
-
32
-
33
-
34
-
35
-
36
-
37
-
38
-
39
-
40
-
41
-
42
-
43
-
44
-
45
-
46
-
47
-
48
-
49
-
50
-
51
-
52
-
53
-
54
-
55
-
56
-
57
-
58
-
59
-
60
-
61
-
62
-
63
-
64
-
65
-
66
-
67
-
68
-
69
-
70
-
71
-
72
-
73
-
74
-
75
-
 76
76 -
 77
77 -
 78
78 -
 79
79 -
 80
80 -
 81
81 -
 82
82 -
 83
83 -
 84
84 -
 85
85 -
 86
86 -
 87
87 -
 88
88 -
 89
89 -
 90
90 -
 91
91 -
 92
92 -
 93
93 -
 94
94 -
 95
95 -
 96
96 -
97
-
98
-
99
-
100
-
101
-
102
-
103
-
104
-
105
-
106
-
107
-
108
-
109
-
110
-
111
-
112
-
113
-
114
-
115
-
116
-
117
-
118
-
119
-
120
-
121
-
122
-
123
-
124
-
125
-
126
-
127
-
128
-
129
-
130
-
131
-
132
-
133
-
134
-
135
-
136
-
137
-
138
-
139
-
140
-
141
-
142
-
143
-
144
-
145
-
146
-
147
-
148
-
149
-
150
-
151
-
152
-
153
-
154
-
155
-
156
-
157
-
158
-
159
-
160
-
161
-
162
-
163
-
164
-
165
-
166
-
167
-
168
-
169
-
170
-
171
-
172
 |
 |

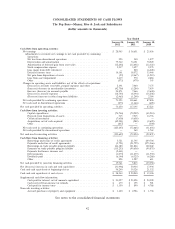
CONSOLIDATED STATEMENTS OF CASH FLOWS
The Pep Boys—Manny, Moe & Jack and Subsidiaries
(dollar amounts in thousands)
Year Ended
January 28, January 29, January 30,
2012 2011 2010
Cash flows from operating activities:
Net earnings ............................................ $ 28,903 $ 36,631 $ 23,036
Adjustments to reconcile net earnings to net cash provided by continuing
operations:
Net loss from discontinued operations . . . . . . . . . . . . . . . . . . . . . . . . . 225 540 1,077
Depreciation and amortization .............................. 79,542 74,151 70,529
Amortization of deferred gain from asset sales .................... (12,602) (12,602) (12,325)
Stock compensation expense ............................... 3,237 3,497 2,575
Loss (gain) from debt retirement . . . . . . . . . . . . . . . . . . . . . . . . . . . . — 200 (6,248)
Deferred income taxes ................................... 10,301 18,572 13,446
Net gain from dispositions of assets . . . . . . . . . . . . . . . . . . . . . . . . . . . (27) (2,467) (1,213)
Loss from asset impairment ................................ 1,619 970 2,884
Other .............................................. (573) (479) 345
Changes in operating assets and liabilities, net of the effects of acquisitions:
Decrease in accounts receivable, prepaid expenses and other ........... 2,391 7,060 7,175
(Increase) decrease in merchandise inventories .................... (42,756) (5,284) 7,039
Increase (decrease) in accounts payable ........................ 24,871 7,466 (9,640)
Decrease in accrued expenses ............................... (18,745) (8,394) (13,238)
(Decrease) increase in other long-term liabilities ................... (2,463) (1,200) 2,384
Net cash provided by continuing operations ......................... 73,923 118,661 87,826
Net cash used in discontinued operations .......................... (273) (1,466) (603)
Net cash provided by operating activities ............................ 73,650 117,195 87,223
Cash flows from investing activities:
Capital expenditures .................................... (74,746) (70,252) (43,214)
Proceeds from dispositions of assets . . . . . . . . . . . . . . . . . . . . . . . . . . . 515 7,515 14,776
Collateral investment .................................... (7,638) (9,638) —
Acquisitions, net of cash acquired. ........................... (42,901) (288) (2,695)
Other .............................................. (837) — (500)
Net cash used in continuing operations ............................ (125,607) (72,663) (31,633)
Net cash provided by discontinued operations . . . . . . . . . . . . . . . . . . . . . . . — 569 1,762
Net cash used in investing activities ............................... (125,607) (72,094) (29,871)
Cash flows from financing activities:
Borrowings under line of credit agreements ...................... 5,721 21,795 249,704
Payments under line of credit agreements ....................... (5,721) (21,795) (273,566)
Borrowings on trade payable program liability .................... 144,180 121,824 102,042
Payments on trade payable program liability ..................... (115,253) (99,636) (99,873)
Payments for finance issuance cost ............................ (2,441) — —
Debt payments ........................................ (1,079) (11,279) (11,990)
Dividends paid ........................................ (6,344) (6,323) (6,286)
Other.............................................. 898 1,227 611
Net cash provided by (used in) financing activities ...................... 19,961 5,813 (39,358)
Net (decrease) increase in cash and cash equivalents .................... (31,996) 50,914 17,994
Cash and cash equivalents at beginning of year ........................ 90,240 39,326 21,332
Cash and cash equivalents at end of year ............................ $ 58,244 $ 90,240 $ 39,326
Supplemental cash flow information:
Cash paid for interest, net of amounts capitalized .................. $ 23,097 $ 23,098 $ 24,509
Cash received from income tax refunds . . . . . . . . . . . . . . . . . . . . . . . . . $ 479 $ 195 $ 921
Cash paid for income taxes ................................ $ 1,150 $ 890 $ 4,768
Non-cash investing activities:
Accrued purchases of property and equipment .................... $ 1,400 $ 2,926 $ 1,738
See notes to the consolidated financial statements
42