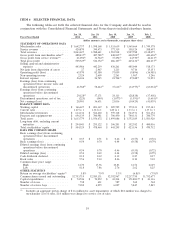
Pep Boys 2011 Annual Report Download - page 73
Download and view the complete annual report
Please find page 73 of the 2011 Pep Boys annual report below. You can navigate through the pages in the report by either clicking on the pages listed below, or by using the keyword search tool below to find specific information within the annual report.-
 1
1 -
2
-
3
-
4
-
5
-
6
-
7
-
8
-
9
-
10
-
11
-
12
-
13
-
14
-
15
-
16
-
17
-
18
-
19
-
20
-
21
-
22
-
23
-
24
-
25
-
26
-
27
-
28
-
29
-
30
-
31
-
32
-
33
-
34
-
35
-
36
-
37
-
38
-
39
-
40
-
41
-
42
-
43
-
44
-
45
-
46
-
47
-
48
-
49
-
50
-
51
-
52
-
53
-
54
-
55
-
56
-
57
-
58
-
59
-
60
-
61
-
62
-
 63
63 -
 64
64 -
 65
65 -
 66
66 -
 67
67 -
 68
68 -
 69
69 -
 70
70 -
 71
71 -
 72
72 -
 73
73 -
 74
74 -
 75
75 -
 76
76 -
 77
77 -
 78
78 -
 79
79 -
 80
80 -
 81
81 -
 82
82 -
 83
83 -
84
-
85
-
86
-
87
-
88
-
89
-
90
-
91
-
92
-
93
-
94
-
95
-
96
-
97
-
98
-
99
-
100
-
101
-
102
-
103
-
104
-
105
-
106
-
107
-
108
-
109
-
110
-
111
-
112
-
113
-
114
-
115
-
116
-
117
-
118
-
119
-
120
-
121
-
122
-
123
-
124
-
125
-
126
-
127
-
128
-
129
-
130
-
131
-
132
-
133
-
134
-
135
-
136
-
137
-
138
-
139
-
140
-
141
-
142
-
143
-
144
-
145
-
146
-
147
-
148
-
149
-
150
-
151
-
152
-
153
-
154
-
155
-
156
-
157
-
158
-
159
-
160
-
161
-
162
-
163
-
164
-
165
-
166
-
167
-
168
-
169
-
170
-
171
-
172
 |
 |
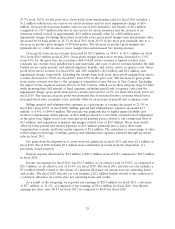
end of fiscal 2010 year end, (including inventory acquired as part of store acquisitions which is shown
in acquisition, net of cash acquired on the consolidated statement of cash flows) was due to
(i) investment in our new or acquired stores of $11.0 million, (ii) higher inventory balances due to
increase in commodity pricing including tires and oil based products of $14.4 million, and (iii) increased
inventory coverage in certain tire and hard part categories.
The change in accrued expenses and other current assets was primarily due to the reduction in
401(k) employer match, decrease in supplemental executive retirement plan pension accruals and lower
short-term bonus compensation accruals of $11.1 million.
Cash used in investing activities was $125.6 million in fiscal 2011 as compared to $72.1 million in
the prior year, an increase of $53.5 million. During fiscal 2011, we acquired 99 Service & Tire Centers
through three separate transactions, including 85 stores in Florida, Georgia and Alabama, seven stores
in Houston and seven stores in the Seattle/Tacoma market for $42.6 million, net of cash acquired (see
Note 2 of the Notes to Consolidated Financial Statements in ‘‘Item 8 Financial Statements and
Supplementary Data’’). Capital expenditures were $74.7 million and $70.3 million in fiscal 2011 and
2010, respectively. Capital expenditures for fiscal 2011 included the addition of 20 new Service & Tire
Centers, one new Supercenter, the conversion of one Service & Tire Center and one Pep Express store
to Supercenters, and the conversion of 19 Supercenters into Superhubs in addition to our regularly
scheduled store and distribution center improvements and information technology enhancements.
During fiscal 2011, we sold the last remaining store classified as held for disposal at its carrying value
of $0.5 million. During fiscal 2010, we sold seven properties classified as held for disposal for net
proceeds of $4.3 million, of which $0.6 million is included in discontinued operations, completed one
sale leaseback transaction for net proceeds of $1.6 million and received $2.1 million in net settlement
proceeds from the disposition of a previously closed property.
Our targeted capital expenditures for fiscal 2012 are expected to be approximately $80.0 million.
Our fiscal 2012 capital expenditures include the addition of approximately 75 Service & Tire Centers,
10 Supercenters and the conversion of 15 Supercenters into Superhubs. These expenditures are
expected to be funded by cash on hand and net cash generated from operating activities. Additional
capacity, if needed, exists under our existing line of credit.
In fiscal 2011, cash provided by financing activities improved by $14.2 million to $20.0 million from
$5.8 million in the prior year. In the prior year we repurchased $10.0 million of our outstanding 7.50%
Senior Subordinated Notes for $10.2 million. The balance of the improvement was due to increased
cash provided from our trade payable program of $6.7 million partially offset by the payment of
$2.4 million in financing fees incurred to amend and restate our revolving credit agreement to reduce
its interest rate by 75 basis points and to extend its maturity to July 2016. The trade payable program,
which has an availability of $125.0 million, is funded by various bank participants who have the ability,
but not the obligation, to purchase, directly from our vendors, account receivables owed by Pep Boys.
As of January 28, 2012 and January 29, 2011, we had an outstanding balance (classified as trade
payable program liability on the consolidated balance sheet) of $85.2 million and $56.3 million,
respectively.
We anticipate that cash on hand and cash generated by operating activities will exceed our
expected cash requirements in fiscal year 2012. In addition, we expect to have excess availability under
our existing revolving credit agreement during the entirety of fiscal year 2012. As of January 28, 2012,
we had no borrowings on our revolving credit facility and undrawn availability of $194.9 million.
Our working capital was $166.6 million and $203.4 million at January 28, 2012 and January 29,
2011, respectively. Our long-term debt less current maturities, as a percentage of our total
capitalization, was 36.8% and 38.2% at January 28, 2012 and January 29, 2011, respectively.
29