Pep Boys 2011 Annual Report Download - page 62
Download and view the complete annual report
Please find page 62 of the 2011 Pep Boys annual report below. You can navigate through the pages in the report by either clicking on the pages listed below, or by using the keyword search tool below to find specific information within the annual report.-
 1
1 -
2
-
3
-
4
-
5
-
6
-
7
-
8
-
9
-
10
-
11
-
12
-
13
-
14
-
15
-
16
-
17
-
18
-
19
-
20
-
21
-
22
-
23
-
24
-
25
-
26
-
27
-
28
-
29
-
30
-
31
-
32
-
33
-
34
-
35
-
36
-
37
-
38
-
39
-
40
-
41
-
42
-
43
-
44
-
45
-
46
-
47
-
48
-
49
-
50
-
51
-
 52
52 -
 53
53 -
 54
54 -
 55
55 -
 56
56 -
 57
57 -
 58
58 -
 59
59 -
 60
60 -
 61
61 -
 62
62 -
 63
63 -
 64
64 -
 65
65 -
 66
66 -
 67
67 -
 68
68 -
 69
69 -
 70
70 -
 71
71 -
 72
72 -
73
-
74
-
75
-
76
-
77
-
78
-
79
-
80
-
81
-
82
-
83
-
84
-
85
-
86
-
87
-
88
-
89
-
90
-
91
-
92
-
93
-
94
-
95
-
96
-
97
-
98
-
99
-
100
-
101
-
102
-
103
-
104
-
105
-
106
-
107
-
108
-
109
-
110
-
111
-
112
-
113
-
114
-
115
-
116
-
117
-
118
-
119
-
120
-
121
-
122
-
123
-
124
-
125
-
126
-
127
-
128
-
129
-
130
-
131
-
132
-
133
-
134
-
135
-
136
-
137
-
138
-
139
-
140
-
141
-
142
-
143
-
144
-
145
-
146
-
147
-
148
-
149
-
150
-
151
-
152
-
153
-
154
-
155
-
156
-
157
-
158
-
159
-
160
-
161
-
162
-
163
-
164
-
165
-
166
-
167
-
168
-
169
-
170
-
171
-
172
 |
 |
4APR201217274647
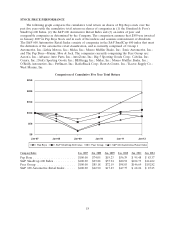
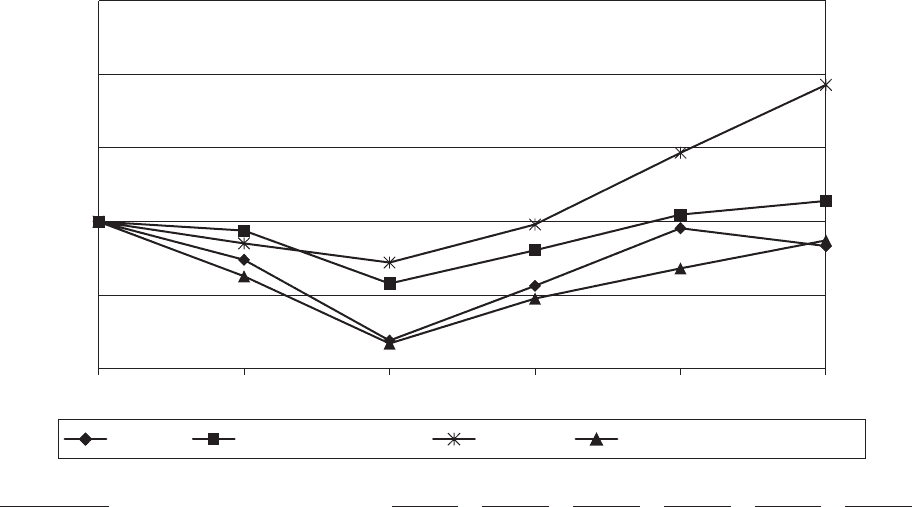
STOCK PRICE PERFORMANCE
The following graph compares the cumulative total return on shares of Pep Boys stock over the
past five years with the cumulative total return on shares of companies in (1) the Standard & Poor’s
SmallCap 600 Index, (2) the S&P 600 Automotive Retail Index and (3) an index of peer and
comparable companies as determined by the Company. The comparison assumes that $100 was invested
in January 2007 in Pep Boys Stock and in each of the indices and assumes reinvestment of dividends.
The S&P 600 Automotive Retail Index consists of companies in the S&P SmallCap 600 index that meet
the definition of the automotive retail classification, and is currently comprised of: Group 1
Automotive, Inc.; Lithia Motors, Inc.; Midas, Inc.; Monro Muffler Brake, Inc.; Sonic Automotive, Inc.;
and The Pep Boys—Manny, Moe & Jack. The companies currently comprising the Peer Group are:
Aaron’s, Inc.; Advance Auto Parts, Inc.; AutoZone, Inc.; Big 5 Sporting Goods Corp.; Cabelas, Inc.;
Conn’s, Inc.; Dick’s Sporting Goods, Inc.; HHGregg, Inc.; Midas, Inc.; Monro Muffler Brake, Inc.;
O’Reilly Automotive, Inc.; PetSmart, Inc.; RadioShack Corp.; Rent-A-Center, Inc.; Tractor Supply Co.;
West Marine, Inc.
Comparison of Cumulative Five Year Total Return
$0
$50
$100
$150
$200
$250
Jan-07 Jan-08 Jan-09 Jan-10 Jan-11 Jan-12
Pep Boys S&P SmallCap 600 Index Peer Group S&P 600 Automotive Retail Index
Company/Index Jan. 2007 Jan. 2008 Jan. 2009 Jan. 2010 Jan. 2011 Jan. 2012
Pep Boys ........................ $100.00 $74.05 $19.23 $56.39 $ 95.48 $ 83.37
S&P SmallCap 600 Index ............ $100.00 $93.88 $57.94 $80.52 $104.73 $114.02
Peer Group ...................... $100.00 $85.18 $72.19 $98.03 $146.69 $192.82
S&P 600 Automotive Retail Index ...... $100.00 $62.90 $17.23 $47.75 $ 68.24 $ 87.25
18