Pep Boys 2011 Annual Report Download - page 111
Download and view the complete annual report
Please find page 111 of the 2011 Pep Boys annual report below. You can navigate through the pages in the report by either clicking on the pages listed below, or by using the keyword search tool below to find specific information within the annual report.-
 1
1 -
2
-
3
-
4
-
5
-
6
-
7
-
8
-
9
-
10
-
11
-
12
-
13
-
14
-
15
-
16
-
17
-
18
-
19
-
20
-
21
-
22
-
23
-
24
-
25
-
26
-
27
-
28
-
29
-
30
-
31
-
32
-
33
-
34
-
35
-
36
-
37
-
38
-
39
-
40
-
41
-
42
-
43
-
44
-
45
-
46
-
47
-
48
-
49
-
50
-
51
-
52
-
53
-
54
-
55
-
56
-
57
-
58
-
59
-
60
-
61
-
62
-
63
-
64
-
65
-
66
-
67
-
68
-
69
-
70
-
71
-
72
-
73
-
74
-
75
-
76
-
77
-
78
-
79
-
80
-
81
-
82
-
83
-
84
-
85
-
86
-
87
-
88
-
89
-
90
-
91
-
92
-
93
-
94
-
95
-
96
-
97
-
98
-
99
-
100
-
 101
101 -
 102
102 -
 103
103 -
 104
104 -
 105
105 -
 106
106 -
 107
107 -
 108
108 -
 109
109 -
 110
110 -
 111
111 -
 112
112 -
 113
113 -
 114
114 -
 115
115 -
 116
116 -
 117
117 -
 118
118 -
 119
119 -
 120
120 -
 121
121 -
122
-
123
-
124
-
125
-
126
-
127
-
128
-
129
-
130
-
131
-
132
-
133
-
134
-
135
-
136
-
137
-
138
-
139
-
140
-
141
-
142
-
143
-
144
-
145
-
146
-
147
-
148
-
149
-
150
-
151
-
152
-
153
-
154
-
155
-
156
-
157
-
158
-
159
-
160
-
161
-
162
-
163
-
164
-
165
-
166
-
167
-
168
-
169
-
170
-
171
-
172
 |
 |

THE PEP BOYS—MANNY, MOE & JACK AND SUBSIDIARIES
NOTES TO CONSOLIDATED FINANCIAL STATEMENTS (Continued)
Years ended January 29, 2011, January 30, 2010 and January 31, 2009
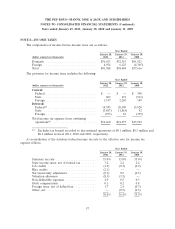
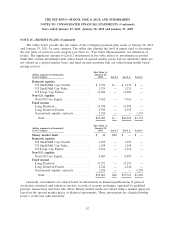
NOTE 13—BENEFIT PLANS (Continued)
The tables below provide the fair values of the Company’s pension plan assets at January 28, 2012
and January 29, 2011, by asset category. The tables also identify the level of inputs used to determine
the fair value of assets in each category (see Note 16, ‘‘Fair Value Measurements’’ for definition of
levels). The significant amount of Level 2 investments in the table relates to investments in pooled
funds that contain investments with values based on quoted market prices, but for which the funds are
not valued on a quoted market basis, and fixed income securities that are valued using model based
pricing services.
Fair Value at
(dollar amounts in thousands) January 28,
Asset Category 2012 Level 1 Level 2 Level 3
Domestic equities
US Small/Mid Cap Growth ........... $ 1,372 $— $ 1,372 $ —
US Small/Mid Cap Value ............. 1,335 — 1,335 —
US Large Cap Passive ............... 11,006 — 11,006 —
Non-U.S. equities
Non-US Core Equity ................ 7,962 — 7,962 —
Fixed income
Long Duration .................... 15,598 — 15,598 —
Long Duration Passive ............... 4,995 — 4,995 —
Guaranteed annuity contracts .......... 1,334 — — 1,334
Total .......................... $43,602 $— $42,268 $1,334
Fair Value at
(dollar amounts in thousands) January 29,
Asset Category 2011 Level 1 Level 2 Level 3
Money market fund .................. $ 48 $48 $ — $ —
Domestic equities
US Small/Mid Cap Growth ........... 1,299 — 1,299 —
US Small/Mid Cap Value ............. 1,298 — 1,298 —
US Large Cap Passive ............... 9,566 — 9,566 —
Non-U.S. equities
Non-US Core Equity ................ 8,087 — 8,087 —
Fixed income
Long Duration .................... 13,271 — 13,271 —
Long Duration Passive ............... 4,244 — 4,244 —
Guaranteed annuity contracts .......... 1,250 — — 1,250
Total .......................... $39,063 $48 $37,765 $1,250
Generally, investments are valued based on information in financial publications of general
circulation, statistical and valuation services, records of security exchanges, appraisal by qualified
persons, transactions and bona fide offers. Money market funds are valued using a market approach
based on the quoted market prices of identical instruments. These investments are classified within
Level 1 of the fair value hierarchy.
67