Pep Boys 2011 Annual Report Download - page 127
Download and view the complete annual report
Please find page 127 of the 2011 Pep Boys annual report below. You can navigate through the pages in the report by either clicking on the pages listed below, or by using the keyword search tool below to find specific information within the annual report.-
 1
1 -
2
-
3
-
4
-
5
-
6
-
7
-
8
-
9
-
10
-
11
-
12
-
13
-
14
-
15
-
16
-
17
-
18
-
19
-
20
-
21
-
22
-
23
-
24
-
25
-
26
-
27
-
28
-
29
-
30
-
31
-
32
-
33
-
34
-
35
-
36
-
37
-
38
-
39
-
40
-
41
-
42
-
43
-
44
-
45
-
46
-
47
-
48
-
49
-
50
-
51
-
52
-
53
-
54
-
55
-
56
-
57
-
58
-
59
-
60
-
61
-
62
-
63
-
64
-
65
-
66
-
67
-
68
-
69
-
70
-
71
-
72
-
73
-
74
-
75
-
76
-
77
-
78
-
79
-
80
-
81
-
82
-
83
-
84
-
85
-
86
-
87
-
88
-
89
-
90
-
91
-
92
-
93
-
94
-
95
-
96
-
97
-
98
-
99
-
100
-
101
-
102
-
103
-
104
-
105
-
106
-
107
-
108
-
109
-
110
-
111
-
112
-
113
-
114
-
115
-
116
-
 117
117 -
 118
118 -
 119
119 -
 120
120 -
 121
121 -
 122
122 -
 123
123 -
 124
124 -
 125
125 -
 126
126 -
 127
127 -
 128
128 -
 129
129 -
 130
130 -
 131
131 -
 132
132 -
 133
133 -
 134
134 -
 135
135 -
 136
136 -
 137
137 -
138
-
139
-
140
-
141
-
142
-
143
-
144
-
145
-
146
-
147
-
148
-
149
-
150
-
151
-
152
-
153
-
154
-
155
-
156
-
157
-
158
-
159
-
160
-
161
-
162
-
163
-
164
-
165
-
166
-
167
-
168
-
169
-
170
-
171
-
172
 |
 |

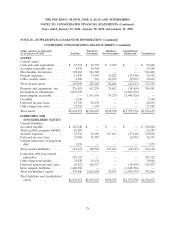
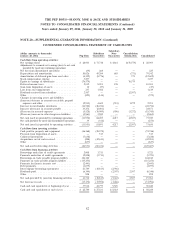
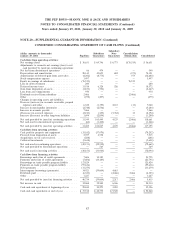
THE PEP BOYS—MANNY, MOE & JACK AND SUBSIDIARIES
NOTES TO CONSOLIDATED FINANCIAL STATEMENTS (Continued)
Years ended January 29, 2011, January 30, 2010 and January 31, 2009
NOTE 20—SUPPLEMENTAL GUARANTOR INFORMATION (Continued)
CONDENSED CONSOLIDATING STATEMENT OF CASH FLOWS (Continued)
Subsidiary
(dollar amounts in thousands) Subsidiary Non- Consolidation
January 29, 2011 Pep Boys Guarantors Guarantors Elimination Consolidated
Cash flows from operating activities:
Net earnings (loss) ...................... $36,631 $ 69,746 $ 6,773 $(76,519) $ 36,631
Adjustments to reconcile net earnings (loss) to net
cash provided by (used in) continuing operations:
Net loss from discontinued operations . . . . . . . . . . 66 474 — — 540
Depreciation and amortization ............... 28,143 45,699 682 (373) 74,151
Amortization of deferred gain from asset sales ..... (4,202) (8,773) — 373 (12,602)
Stock compensation expense ................ 3,497 — — — 3,497
Equity in earnings of subsidiaries ............. (76,519) — — 76,519 —
Loss on debt retirement . . . . . . . . . . . . . . . . . . . 200 — — — 200
Deferred income taxes .................... 11,918 6,328 326 — 18,572
Gain from disposition of assets ............... (1,873) (594) — — (2,467)
Loss from asset impairments . . . . . . . . . . . . . . . . 970 — — — 970
Dividends received from subsidiary ............ 2,466 — — (2,466) —
Other ............................... (272) (207) — — (479)
Changes in operating assets and liabilities:
Decrease (increase) in accounts receivable, prepaid
expenses and other ..................... 6,322 (1,359) 2,110 (13) 7,060
Increase in merchandise inventories ............ (2,748) (2,536) — — (5,284)
Increase in accounts payable ................ 7,466 — — — 7,466
(Decrease) in accrued expenses .............. (2,210) (435) (5,762) 13 (8,394)
Increase (decrease) in other long-term liabilities .... 1,694 (2,894) — — (1,200)
Net cash provided by (used in) continuing operations 11,549 105,449 4,129 (2,466) 118,661
Net cash used in discontinued operations . . . . . . . . (64) (1,402) — — (1,466)
Net cash provided by (used in) operating activities . . 11,485 104,047 4,129 (2,466) 117,195
Cash flows from investing activities:
Cash paid for property and equipment .......... (33,182) (37,070) — — (70,252)
Proceeds from disposition of assets ............ 2,957 4,558 — — 7,515
Acquisitions, net of cash received. ............ (288) — — — (288)
Collateral investments .................... (9,638) — — — (9,638)
Net cash used in continuing operations .......... (40,151) (32,512) — — (72,663)
Net cash provided by discontinued operations . . . . . — 569 — — 569
Net cash used in investing activities ............ (40,151) (31,943) — — (72,094)
Cash flows from financing activities:
Borrowings under line of credit agreements ....... 7,606 14,189 — — 21,795
Payments under line of credit agreements ........ (7,606) (14,189) — — (21,795)
Borrowings on trade payable program liability ..... 121,824 — — — 121,824
Payments on trade payable program liability ...... (99,636) — — — (99,636)
Debt payments ......................... (11,279) — — — (11,279)
Intercompany borrowings (payments) ........... 34,921 (39,604) 4,683 — —
Dividends paid ......................... (6,323) — (2,466) 2,466 (6,323)
Other ............................... 1,227 — — — 1,227
Net cash provided by (used in) financing activities . . 40,734 (39,604) 2,217 2,466 5,813
Net increase in cash ..................... 12,068 32,500 6,346 — 50,914
Cash and cash equivalents at beginning of year .... 25,844 10,279 3,203 — 39,326
Cash and cash equivalents at end of year ........ $37,912 $ 42,779 $ 9,549 $ — $ 90,240
83