Pep Boys 2011 Annual Report Download - page 20
Download and view the complete annual report
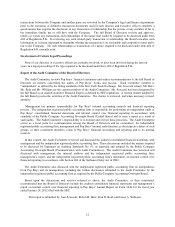
Please find page 20 of the 2011 Pep Boys annual report below. You can navigate through the pages in the report by either clicking on the pages listed below, or by using the keyword search tool below to find specific information within the annual report.-
 1
1 -
2
-
3
-
4
-
5
-
6
-
7
-
8
-
9
-
 10
10 -
 11
11 -
 12
12 -
 13
13 -
 14
14 -
 15
15 -
 16
16 -
 17
17 -
 18
18 -
 19
19 -
 20
20 -
 21
21 -
 22
22 -
 23
23 -
 24
24 -
 25
25 -
 26
26 -
 27
27 -
 28
28 -
 29
29 -
 30
30 -
31
-
32
-
33
-
34
-
35
-
36
-
37
-
38
-
39
-
40
-
41
-
42
-
43
-
44
-
45
-
46
-
47
-
48
-
49
-
50
-
51
-
52
-
53
-
54
-
55
-
56
-
57
-
58
-
59
-
60
-
61
-
62
-
63
-
64
-
65
-
66
-
67
-
68
-
69
-
70
-
71
-
72
-
73
-
74
-
75
-
76
-
77
-
78
-
79
-
80
-
81
-
82
-
83
-
84
-
85
-
86
-
87
-
88
-
89
-
90
-
91
-
92
-
93
-
94
-
95
-
96
-
97
-
98
-
99
-
100
-
101
-
102
-
103
-
104
-
105
-
106
-
107
-
108
-
109
-
110
-
111
-
112
-
113
-
114
-
115
-
116
-
117
-
118
-
119
-
120
-
121
-
122
-
123
-
124
-
125
-
126
-
127
-
128
-
129
-
130
-
131
-
132
-
133
-
134
-
135
-
136
-
137
-
138
-
139
-
140
-
141
-
142
-
143
-
144
-
145
-
146
-
147
-
148
-
149
-
150
-
151
-
152
-
153
-
154
-
155
-
156
-
157
-
158
-
159
-
160
-
161
-
162
-
163
-
164
-
165
-
166
-
167
-
168
-
169
-
170
-
171
-
172
 |
 |

14
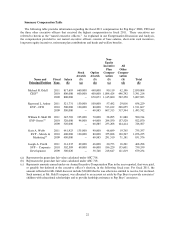
EXECUTIVE COMPENSATION
Compensation Discussion and Analysis
In this section, we discuss and analyze Pep Boys’ executive compensation program, which we believe links pay
to financial results and allows us to attract and retain a highly experienced and successful management team.
The Company provides its shareholders with the opportunity to cast an annual advisory vote on executive
compensation (a “say-on-pay proposal”). At the Company’s annual meeting of shareholders held in June 2011, 97%
of the votes cast on the say-on-pay proposal at that meeting were voted in favor of the Company’s executive
compensation for 2010. The Compensation Committee believes this affirms shareholders’ support of the Company’s
approach to executive compensation. In light of the voting results, the Committee did not materially change its
approach in 2011. The Compensation Committee will continue to consider the outcome of advisory votes on the
Company’s say-on-pay proposals when making future compensation decisions for the named executive officers.
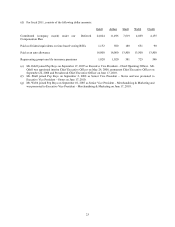
Pay for Performance. Our financial performance in fiscal 2011was disappointing. While we grew our top line
revenues, due largely to our opening of 119 Service & Tire Centers, we failed to improve our profitability over the
levels achieved in fiscal 2010. These disappointing results were reflected in our executive officers’ compensation,
which is heavily weighted towards performance. Because we failed to achieve the majority of the targets set forth
under our annual incentive bonus plan, our executive officers fiscal 2011 bonuses were paid at only 14.7% of target.
In addition, no named executive officer received Company contributions to their retirement plans (neither the
Account Plan nor Savings Plan). As a result our named executive officers total compensation in fiscal 2011 was, on
average, 40% less than in fiscal 2010. Also, 60% of the long-term incentive awards made under our Stock Incentive
Plan in fiscal 2011 require the Company to achieve specified thresholds of return on invested capital and total
shareholder return in fiscal 2014 in order to deliver any value to our executives. The 40% balance of the long-term
incentive awards granted in fiscal 2011 were in the form of stock options, which are also performance-based since
they require appreciation in the Company’s per share stock price in order to deliver value to our executives.
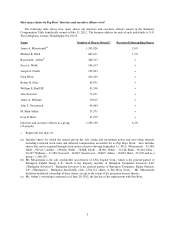
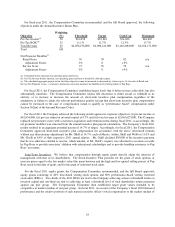
Of the components comprising our executive compensation program, the percentage mix between “at-risk” and
fixed compensation (excluding health and welfare benefits), at target levels, for each of our named executive officers
is set forth in the following table. “At-risk” compensation is only earned and paid if pre-established performance
levels are achieved.
Name“At-Risk” Fixed
Michael R. Odell 73% 27%
Raymond L. Arthur 63% 37%
William E. Shull III 61% 39%
Scott A. Webb 63% 37%
Joseph A. Cirelli 46% 54%