Metro PCS 2007 Annual Report Download - page 88
Download and view the complete annual report
Please find page 88 of the 2007 Metro PCS annual report below. You can navigate through the pages in the report by either clicking on the pages listed below, or by using the keyword search tool below to find specific information within the annual report.-
 1
1 -
2
-
3
-
4
-
5
-
6
-
7
-
8
-
9
-
10
-
11
-
12
-
13
-
14
-
15
-
16
-
17
-
18
-
19
-
20
-
21
-
22
-
23
-
24
-
25
-
26
-
27
-
28
-
29
-
30
-
31
-
32
-
33
-
34
-
35
-
36
-
37
-
38
-
39
-
40
-
41
-
42
-
43
-
44
-
45
-
46
-
47
-
48
-
49
-
50
-
51
-
52
-
53
-
54
-
55
-
56
-
57
-
58
-
59
-
60
-
61
-
62
-
63
-
64
-
65
-
66
-
67
-
68
-
69
-
70
-
71
-
72
-
73
-
74
-
75
-
76
-
77
-
 78
78 -
 79
79 -
 80
80 -
 81
81 -
 82
82 -
 83
83 -
 84
84 -
 85
85 -
 86
86 -
 87
87 -
 88
88 -
 89
89 -
 90
90 -
 91
91 -
 92
92 -
 93
93 -
 94
94 -
 95
95 -
 96
96 -
 97
97 -
 98
98 -
99
-
100
-
101
-
102
-
103
-
104
-
105
-
106
-
107
-
108
-
109
-
110
-
111
-
112
-
113
-
114
-
115
-
116
-
117
-
118
-
119
-
120
-
121
-
122
-
123
-
124
-
125
-
126
-
127
-
128
-
129
-
130
-
131
-
132
-
133
-
134
-
135
-
136
-
137
-
138
-
139
-
140
-
141
-
142
-
143
-
144
-
145
-
146
-
147
-
148
-
149
-
150
-
151
-
152
-
153
-
154
-
155
-
156
-
157
-
158
-
159
-
160
 |
 |
77
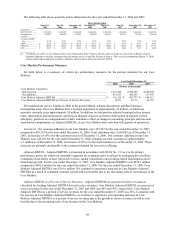
Investing Activities
Cash used in investing activities was $517.1 million during the year ended December 31, 2007 compared to $1.9
billion during the year ended December 31, 2006. The decrease was mainly due to $1.4 billion in purchases of FCC
licenses during the year ended December 31, 2006 that did not recur in 2007 as well as a $264.7 million increase in
net proceeds from the sale of investments, partially offset by a $217.0 million increase in purchases of property and
equipment.
Cash used in investing activities was $1.9 billion during the year ended December 31, 2006 compared to
$905.2 million during the year ended December 31, 2005. The increase was due primarily to a $887.7 million
increase in purchases of FCC licenses and a $284.3 million increase in purchases of property and equipment,
partially offset by a $355.5 million decrease in net purchases of investments.
Cash used in investing activities was $905.2 million during the year ended December 31, 2005 compared to
$190.9 million during the year ended December 31, 2004. This increase was due primarily to a $416.9 million
increase in the purchase of FCC licenses, an increase in purchases of investments in the amount of $580.8 million,
and a $27.5 million increase in purchases of property and equipment, partially offset by proceeds of $230.0 million
from the sale of a 10 MHz portion of our 30 MHz PCS license for the San Francisco-Oakland-San Jose basic trading
area.
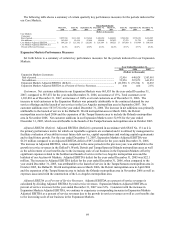
Financing Activities
Cash provided by financing activities was $1.2 billion for the year ended December 31, 2007 compared to $1.6
billion for the year ended December 31, 2006. The decrease was due primarily to a decrease in proceeds from
various financing activities during the year ended December 31, 2007 compared to the year ended December 31,
2006. Financing activities during the year ended December 31, 2007 included $818.3 million in net proceeds from
the company’ s initial public offering that was completed in April 2007 and $421.0 million in net proceeds from the
sale of additional notes in June 2007.
Cash provided by financing activities was $1.6 billion for the year ended December 31, 2006 compared to
$712.2 million for the year ended December 31, 2005. The increase was due primarily to net proceeds from the
senior secured credit facility and the 9¼% senior notes.
Cash provided by financing activities during the year ended December 31, 2005 was $712.2 million, compared to
cash used in financing activities of $5.4 million for the year ended December 31, 2004. The increase during 2005 is
mainly attributable to proceeds from borrowings under our first and second lien credit agreements of $902.9 million
as well as net proceeds from the issuance of Series E Preferred Stock in the amount of $46.7 million. These proceeds
are partially offset by various transactions including repayment of the FCC notes in the amount of $33.4 million,
repayment of the 10¾% senior notes in the amount of $178.9 million, which included a premium of $28.9 million,
and payment of debt issuance costs in the amount of $29.5 million.
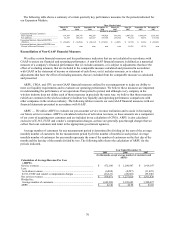
First and Second Lien Credit Agreements
On November 3, 2006, we paid the lenders under the first and second lien credit agreements $931.5 million plus
accrued interest of $8.6 million to extinguish the aggregate outstanding principal balance under the first and second
lien credit agreements. As a result, we recorded a loss on extinguishment of debt in the amount of approximately
$42.7 million.
On November 21, 2006, we terminated the interest rate cap agreement that was required by our first and second
lien credit agreements. We received approximately $4.3 million upon termination of the agreement. The proceeds
from the termination of the agreement approximated its carrying value.
Bridge Credit Facilities
In July 2006, MetroPCS II, Inc., or MetroPCS II, an indirect wholly-owned subsidiary of MetroPCS
Communications, Inc. (which has since merged into MetroPCS Wireless, Inc.), entered into an Exchangeable Senior
Secured Credit Agreement and Guaranty Agreement, dated as of July 13, 2006, or the secured bridge credit facility.
The aggregate credit commitments available under the secured bridge credit facility were $1.25 billion and were
fully funded.