Metro PCS 2007 Annual Report Download - page 128
Download and view the complete annual report
Please find page 128 of the 2007 Metro PCS annual report below. You can navigate through the pages in the report by either clicking on the pages listed below, or by using the keyword search tool below to find specific information within the annual report.-
 1
1 -
2
-
3
-
4
-
5
-
6
-
7
-
8
-
9
-
10
-
11
-
12
-
13
-
14
-
15
-
16
-
17
-
18
-
19
-
20
-
21
-
22
-
23
-
24
-
25
-
26
-
27
-
28
-
29
-
30
-
31
-
32
-
33
-
34
-
35
-
36
-
37
-
38
-
39
-
40
-
41
-
42
-
43
-
44
-
45
-
46
-
47
-
48
-
49
-
50
-
51
-
52
-
53
-
54
-
55
-
56
-
57
-
58
-
59
-
60
-
61
-
62
-
63
-
64
-
65
-
66
-
67
-
68
-
69
-
70
-
71
-
72
-
73
-
74
-
75
-
76
-
77
-
78
-
79
-
80
-
81
-
82
-
83
-
84
-
85
-
86
-
87
-
88
-
89
-
90
-
91
-
92
-
93
-
94
-
95
-
96
-
97
-
98
-
99
-
100
-
101
-
102
-
103
-
104
-
105
-
106
-
107
-
108
-
109
-
110
-
111
-
112
-
113
-
114
-
115
-
116
-
117
-
 118
118 -
 119
119 -
 120
120 -
 121
121 -
 122
122 -
 123
123 -
 124
124 -
 125
125 -
 126
126 -
 127
127 -
 128
128 -
 129
129 -
 130
130 -
 131
131 -
 132
132 -
 133
133 -
 134
134 -
 135
135 -
 136
136 -
 137
137 -
 138
138 -
139
-
140
-
141
-
142
-
143
-
144
-
145
-
146
-
147
-
148
-
149
-
150
-
151
-
152
-
153
-
154
-
155
-
156
-
157
-
158
-
159
-
160
 |
 |

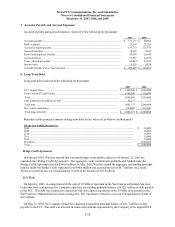
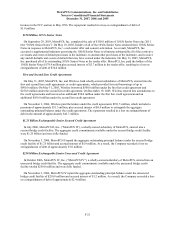
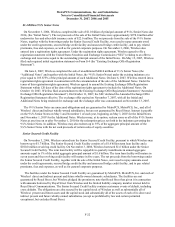
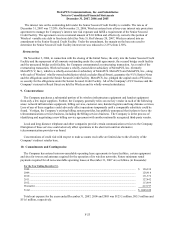
MetroPCS Communications, Inc. and Subsidiaries
Notes to Consolidated Financial Statements
December 31, 2007, 2006 and 2005
F-29
2007 2006 2005
Expected dividends............................................................................................................. 0.00% 0.00% 0.00%
Expected volatility .............................................................................................................. 42.69% 35.04% 50.00%
Risk-free interest rate.......................................................................................................... 4.54% 4.64% 4.24%
Expected lives in years ....................................................................................................... 5.00 5.00 5.00
Weighted-average fair value of options:
Granted at below fair value................................................................................................. $ — $ 10.16 $ —
Granted at fair value ........................................................................................................... $ 9.89 $ 3.75 $ 3.44
Weighted-average exercise price of options:
Granted at below fair value................................................................................................. $ — $ 1.49 $ —
Granted at fair value ........................................................................................................... $ 22.41 $ 9.95 $ 7.13
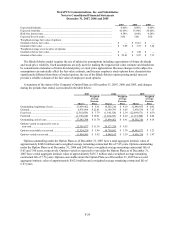
The Black-Scholes model requires the use of subjective assumptions including expectations of future dividends
and stock price volatility. Such assumptions are only used for making the required fair value estimate and should not
be considered as indicators of future dividend policy or stock price appreciation. Because changes in the subjective
assumptions can materially affect the fair value estimate, and because employee stock options have characteristics
significantly different from those of traded options, the use of the Black-Scholes option pricing model may not
provide a reliable estimate of the fair value of employee stock options.
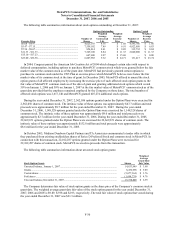
A summary of the status of the Company’ s Option Plans as of December 31, 2007, 2006 and 2005, and changes
during the periods then ended, is presented in the table below:
2007 2006 2005
Shares
Weighted
Average
Exercise
Price
Shares
Weighted
Average
Exercise
Price
Shares
Weighted
Average
Exercise
Price
Outstanding, beginning of year............................ 23,499,462 $ 6.91 14,502,210 $ 4.18 32,448,855 $ 0.92
Granted ................................................................ 8,476,998 $ 22.41 11,369,793 $ 9.65 5,838,534 $ 7.13
Exercised ............................................................. (2,562,056) $ 3.79 (1,148,328) $ 2.39 (22,669,671) $ 0.38
Forfeited .............................................................. (1,770,610) $ 10.81 (1,224,213) $ 4.22 (1,115,508) $ 4.04
Outstanding, end of year...................................... 27,643,794 $ 11.70 23,499,462 $ 6.91 14,502,210 $ 4.18
Options vested or expected to vest at
year-end............................................................. 25,395,877 $ 11.36 20,127,759 $ 6.55
Options exercisable at year-end ........................... 12,524,250 $ 5.86 10,750,692 $ 3.78 10,985,577 $ 3.23
Options vested at year-end................................... 11,904,985 $ 5.82 8,940,615 $ 3.59 6,696,330 $ 1.87
Options outstanding under the Option Plans as of December 31, 2007 have a total aggregate intrinsic value of
approximately $248.8 million and a weighted average remaining contractual life of 7.85 years. Options outstanding
under the Option Plans as of December 31, 2006 and 2005 have a weighted average remaining contractual life of
8.01 and 7.80 years, respectively. Options vested or expected to vest under the Option Plans as of December 31,
2007 have a total aggregate intrinsic value of approximately $235.7 million and a weighted average remaining
contractual life of 7.76 years. Options exercisable under the Option Plans as of December 31, 2007 have a total
aggregate intrinsic value of approximately $162.8 million and a weighted average remaining contractual life of
6.43 years.