Metro PCS 2007 Annual Report Download - page 84
Download and view the complete annual report
Please find page 84 of the 2007 Metro PCS annual report below. You can navigate through the pages in the report by either clicking on the pages listed below, or by using the keyword search tool below to find specific information within the annual report.-
 1
1 -
2
-
3
-
4
-
5
-
6
-
7
-
8
-
9
-
10
-
11
-
12
-
13
-
14
-
15
-
16
-
17
-
18
-
19
-
20
-
21
-
22
-
23
-
24
-
25
-
26
-
27
-
28
-
29
-
30
-
31
-
32
-
33
-
34
-
35
-
36
-
37
-
38
-
39
-
40
-
41
-
42
-
43
-
44
-
45
-
46
-
47
-
48
-
49
-
50
-
51
-
52
-
53
-
54
-
55
-
56
-
57
-
58
-
59
-
60
-
61
-
62
-
63
-
64
-
65
-
66
-
67
-
68
-
69
-
70
-
71
-
72
-
73
-
 74
74 -
 75
75 -
 76
76 -
 77
77 -
 78
78 -
 79
79 -
 80
80 -
 81
81 -
 82
82 -
 83
83 -
 84
84 -
 85
85 -
 86
86 -
 87
87 -
 88
88 -
 89
89 -
 90
90 -
 91
91 -
 92
92 -
 93
93 -
 94
94 -
95
-
96
-
97
-
98
-
99
-
100
-
101
-
102
-
103
-
104
-
105
-
106
-
107
-
108
-
109
-
110
-
111
-
112
-
113
-
114
-
115
-
116
-
117
-
118
-
119
-
120
-
121
-
122
-
123
-
124
-
125
-
126
-
127
-
128
-
129
-
130
-
131
-
132
-
133
-
134
-
135
-
136
-
137
-
138
-
139
-
140
-
141
-
142
-
143
-
144
-
145
-
146
-
147
-
148
-
149
-
150
-
151
-
152
-
153
-
154
-
155
-
156
-
157
-
158
-
159
-
160
 |
 |

73
Year Ended December 31,
2005 2006 2007
(In thousands, except average number of customers and
CPU)
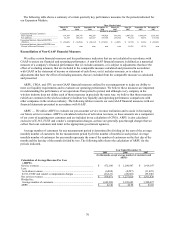
Calculation of Cost Per User (CPU):
Cost of service ........................................................................................ $ 283,212 $ 445,281 $ 647,510
Add:
General and administrative expense ...................................................... 100,080 138,998 198,955
Add:
Net loss on equipment transactions unrelated to initial customer
acquisition ........................................................................................... 32,791 41,538 49,331
Less:
Stock-based compensation expense included in cost of service and
general and administrative expense ..................................................... (2,596) (14,472) (28,024)
Less:
E-911, FUSF and vendor’ s compensation revenues .............................. (26,221) (45,640) (95,946)
Total costs used in the calculation of CPU ............................................. $ 387,266 $ 565,705 $ 771,826
Divided by:
Average number of customers ............................................................... 1,649,208 2,398,682 3,508,497
CPU ........................................................................................................ $ 19.57 $ 19.65 $ 18.33
Three Months Ended
March 31,
2006
June 30,
2006
September 30,
2006
December 31,
2006
(In thousands, except average number of customers and CPU)
Calculation of Cost Per User (CPU):
Cost of service ................................................................................ $ 92,489 $ 107,497 $ 113,524 $ 131,771
Add:
General and administrative expense .............................................. 31,139 33,827 34,158 39,874
Add:
Net loss on equipment transactions unrelated to initial
customer acquisition.................................................................... 10,500 7,765 9,457 13,816
Less:
Stock-based compensation expense included in general and
administrative expense ................................................................ (1,811) (2,158) (3,781) (6,722)
Less:
E-911, FUSF and vendor’ s compensation revenues ...................... (8,958) (10,752) (9,512) (16,418)
Total costs used in the calculation of CPU ..................................... $ 123,359 $ 136,179 $ 143,846 $ 162,321
Divided by:
Average number of customers ....................................................... 2,045,110 2,295,249 2,503,423 2,750,943
CPU ................................................................................................ $ 20.11 $ 19.78 $ 19.15 $ 19.67
Three Months Ended
March 31,
2007
June 30,
2007
September 30,
2007
December 31,
2007
(In thousands, except average number of customers and CPU)
Calculation of Cost Per User (CPU):
Cost of service ................................................................................ $ 145,335 $ 162,227 $ 163,671 $ 176,277
Add:
General and administrative expense .............................................. 42,831 49,352 48,871 57,900
Add:
Net loss on equipment transactions unrelated to initial
customer acquisition.................................................................... 13,160 9,903 11,664 14,606
Less:
Stock-based compensation expense included in general and
administrative expense ................................................................ (4,211) (7,653) (7,107) (9,053)
Less:
E-911, FUSF and vendor’ s compensation revenues ...................... (20,271) (25,721) (25,215) (24,740)
Total costs used in the calculation of CPU ..................................... $ 176,844 $ 188,108 $ 191,884 $ 214,990
Divided by:
Average number of customers ....................................................... 3,175,284 3,480,780 3,592,045 3,785,880
CPU ................................................................................................ $ 18.56 $ 18.01 $ 17.81 $ 18.93
Liquidity and Capital Resources
Our principal sources of liquidity are our existing cash, cash equivalents and short-term investments and cash
generated from operations. At December 31, 2007, we had a total of approximately $1.5 billion in cash and cash
equivalents. We have historically invested our substantial cash balances in, among other things, securities issued and
fully guaranteed by the United States or any state, highly rated commercial paper and auction rate securities, money