Metro PCS 2007 Annual Report Download - page 76
Download and view the complete annual report
Please find page 76 of the 2007 Metro PCS annual report below. You can navigate through the pages in the report by either clicking on the pages listed below, or by using the keyword search tool below to find specific information within the annual report.-
 1
1 -
2
-
3
-
4
-
5
-
6
-
7
-
8
-
9
-
10
-
11
-
12
-
13
-
14
-
15
-
16
-
17
-
18
-
19
-
20
-
21
-
22
-
23
-
24
-
25
-
26
-
27
-
28
-
29
-
30
-
31
-
32
-
33
-
34
-
35
-
36
-
37
-
38
-
39
-
40
-
41
-
42
-
43
-
44
-
45
-
46
-
47
-
48
-
49
-
50
-
51
-
52
-
53
-
54
-
55
-
56
-
57
-
58
-
59
-
60
-
61
-
62
-
63
-
64
-
65
-
 66
66 -
 67
67 -
 68
68 -
 69
69 -
 70
70 -
 71
71 -
 72
72 -
 73
73 -
 74
74 -
 75
75 -
 76
76 -
 77
77 -
 78
78 -
 79
79 -
 80
80 -
 81
81 -
 82
82 -
 83
83 -
 84
84 -
 85
85 -
 86
86 -
87
-
88
-
89
-
90
-
91
-
92
-
93
-
94
-
95
-
96
-
97
-
98
-
99
-
100
-
101
-
102
-
103
-
104
-
105
-
106
-
107
-
108
-
109
-
110
-
111
-
112
-
113
-
114
-
115
-
116
-
117
-
118
-
119
-
120
-
121
-
122
-
123
-
124
-
125
-
126
-
127
-
128
-
129
-
130
-
131
-
132
-
133
-
134
-
135
-
136
-
137
-
138
-
139
-
140
-
141
-
142
-
143
-
144
-
145
-
146
-
147
-
148
-
149
-
150
-
151
-
152
-
153
-
154
-
155
-
156
-
157
-
158
-
159
-
160
 |
 |

65
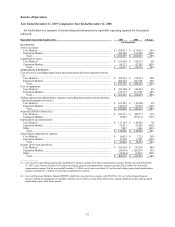
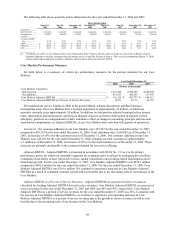
• Expansion Markets. Expansion Markets depreciation and amortization expense increased $19.9 million to
$21.9 million for the year ended December 31, 2006 from $2.0 million for the year ended December 31,
2005. The increase related to network infrastructure assets that were placed into service as a result of the
launch of the Dallas/Ft. Worth metropolitan area, the Detroit metropolitan area, and expansion of the
Tampa/Sarasota area to include the Orlando metropolitan area.
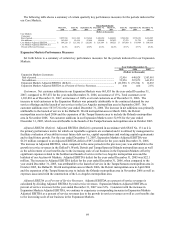
Stock-Based Compensation Expense. Stock-based compensation expense increased $11.9 million, or 457%, to
$14.5 million for the year ended December 31, 2006 from $2.6 million for the year ended December 31, 2005. The
increase is primarily due to increases in Core Markets and Expansion Markets stock-based compensation expense as
follows:
• Core Markets. Core Markets stock-based compensation expense increased $5.1 million, or 198%, to
$7.7 million for the year ended December 31, 2006 from $2.6 million for the year ended December 31, 2005.
The increase is primarily related to the adoption of SFAS No. 123(R) on January 1, 2006. In addition, in
December 2006, we amended the stock option agreements of a former member of our board of directors to
extend the contractual life of 405,054 vested options to purchase common stock until December 31, 2006.
This amendment resulted in the recognition of additional stock-based compensation expense of
approximately $4.1 million in the fourth quarter of 2006.
• Expansion Markets. Expansion Markets stock-based compensation expense was $6.8 million for the year
ended December 31, 2006. This expense is attributable to stock options granted to employees in our
Expansion Markets which are being accounted for under SFAS No. 123(R) as of January 1, 2006.
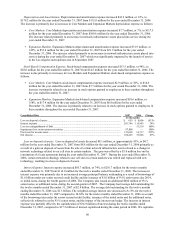
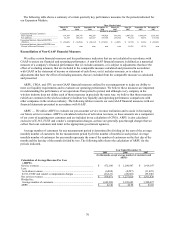
Consolidated Data 2006 2005 Change
(In thousands)
Loss (gain) on disposal of assets..................................................................... $ 8,806 $ (218,203) 104%
Loss on extinguishment of debt ...................................................................... 51,518 46,448 11%
Interest expense .............................................................................................. 115,985 58,033 100%
Provision for income taxes.............................................................................. 36,717 127,425 (72)%
Net income...................................................................................................... 53,806 198,677 (73)%
Loss (Gain) on Disposal of Assets. In May 2005, we completed the sale of a 10 MHz portion of our 30 MHz PCS
license in the San Francisco-Oakland-San Jose basic trading area for cash consideration of $230.0 million. The sale
of PCS spectrum resulted in a gain on disposal of asset in the amount of $228.2 million.
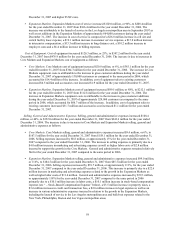
Loss on Extinguishment of Debt. In November 2006, we repaid all amounts outstanding under our first and
second lien credit agreements and the exchangeable secured and unsecured bridge credit agreements. As a result, we
recorded a loss on extinguishment of debt in the amount of approximately $42.7 million of the first and second lien
credit agreements and an approximately $9.4 million loss on the extinguishment of the exchangeable secured and
unsecured bridge credit agreements. In May 2005, we repaid all of the outstanding debt under our FCC notes, 10¾%
senior notes and bridge credit agreement. As a result, we recorded a $1.9 million loss on the extinguishment of the
FCC notes; a $34.0 million loss on extinguishment of the 10 ¾% senior notes due 2011, or 10¾% senior notes; and
a $10.4 million loss on the extinguishment of the bridge credit agreement.
Interest Expense. Interest expense increased $58.0 million, or 100%, to $116.0 million for the year ended
December 31, 2006 from $58.0 million for the year ended December 31, 2005. The increase in interest expense was
primarily due to increased average principal balance outstanding as a result of additional borrowings of
$150.0 million under our first and second lien credit agreements in the fourth quarter of 2005, $200.0 million under
the secured bridge credit facility in the third quarter of 2006 and an additional $1,300.0 million under the secured
and unsecured bridge credit facilities in the fourth quarter of 2006. Interest expense also increased due to the
weighted average interest rate increasing to 10.30% for the year ended December 31, 2006 compared to 8.92% for
the year ended December 31, 2005. The increase in interest expense was partially offset by the capitalization of
$17.5 million of interest during the year ended December 31, 2006, compared to $3.6 million of interest capitalized
during the same period in 2005. We capitalize interest costs associated with our FCC licenses and property and
equipment beginning with pre-construction period administrative and technical activities, which includes obtaining
leases, zoning approvals and building permits. The amount of such capitalized interest depends on the carrying
values of the FCC licenses and construction in progress involved in those markets and the duration of the
construction process. With respect to our FCC licenses, capitalization of interest costs ceases at the point in time in
which the asset is ready for its intended use, which generally coincides with the market launch date. In the case of
our property and equipment, capitalization of interest costs ceases at the point in time in which the network assets