Metro PCS 2007 Annual Report Download - page 82
Download and view the complete annual report
Please find page 82 of the 2007 Metro PCS annual report below. You can navigate through the pages in the report by either clicking on the pages listed below, or by using the keyword search tool below to find specific information within the annual report.-
 1
1 -
2
-
3
-
4
-
5
-
6
-
7
-
8
-
9
-
10
-
11
-
12
-
13
-
14
-
15
-
16
-
17
-
18
-
19
-
20
-
21
-
22
-
23
-
24
-
25
-
26
-
27
-
28
-
29
-
30
-
31
-
32
-
33
-
34
-
35
-
36
-
37
-
38
-
39
-
40
-
41
-
42
-
43
-
44
-
45
-
46
-
47
-
48
-
49
-
50
-
51
-
52
-
53
-
54
-
55
-
56
-
57
-
58
-
59
-
60
-
61
-
62
-
63
-
64
-
65
-
66
-
67
-
68
-
69
-
70
-
71
-
 72
72 -
 73
73 -
 74
74 -
 75
75 -
 76
76 -
 77
77 -
 78
78 -
 79
79 -
 80
80 -
 81
81 -
 82
82 -
 83
83 -
 84
84 -
 85
85 -
 86
86 -
 87
87 -
 88
88 -
 89
89 -
 90
90 -
 91
91 -
 92
92 -
93
-
94
-
95
-
96
-
97
-
98
-
99
-
100
-
101
-
102
-
103
-
104
-
105
-
106
-
107
-
108
-
109
-
110
-
111
-
112
-
113
-
114
-
115
-
116
-
117
-
118
-
119
-
120
-
121
-
122
-
123
-
124
-
125
-
126
-
127
-
128
-
129
-
130
-
131
-
132
-
133
-
134
-
135
-
136
-
137
-
138
-
139
-
140
-
141
-
142
-
143
-
144
-
145
-
146
-
147
-
148
-
149
-
150
-
151
-
152
-
153
-
154
-
155
-
156
-
157
-
158
-
159
-
160
 |
 |

71
Three Months Ended
March 31,
2006
June 30,
2006
September 30,
2006
December 31,
2006
(In thousands, except average number of customers and ARPU)
Calculation of Average Revenue Per User (ARPU):
Service revenues ....................................................................... $ 275,416 $ 307,843 $ 332,920 $ 374,768
Less:
Activation revenues ................................................................. (1,923) (1,979) (2,123) (2,272)
E-911, FUSF and vendor’ s compensation charges .................. (8,958) (10,752) (9,512) (16,418)
Net service revenues ................................................................. $ 264,535 $ 295,112 $ 321,285 $ 356,078
Divided by: Average number of customers .............................. 2,045,110 2,295,249 2,503,423 2,750,943
ARPU ....................................................................................... $ 43.12 $ 42.86 $ 42.78 $ 43.15
Three Months Ended
March 31,
2007
June 30,
2007
September 30,
2007
December 31,
2007
(In thousands, except average number of customers and ARPU)
Calculation of Average Revenue Per User (ARPU):
Service revenues ....................................................................... $ 439,516 $ 479,341 $ 489,131 $ 511,209
Less:
Activation revenues ................................................................. (2,459) (2,683) (2,995) (3,287)
E-911, FUSF and vendor’ s compensation charges .................. (20,271) (25,721) (25,215) (24,740)
Net service revenues ................................................................. $ 416,786 $ 450,937 $ 460,921 $ 483,182
Divided by: Average number of customers .............................. 3,175,284 3,480,780 3,592,045 3,785,880
ARPU ....................................................................................... $ 43.75 $ 43.18 $ 42.77 $ 42.54
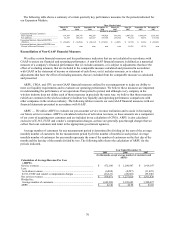
CPGA — We utilize CPGA to assess the efficiency of our distribution strategy, validate the initial capital
invested in our customers and determine the number of months to recover our customer acquisition costs. This
measure also allows us to compare our average acquisition costs per new customer to those of other wireless
broadband PCS providers. Activation revenues and equipment revenues related to new customers are deducted from
selling expenses in this calculation as they represent amounts paid by customers at the time their service is activated
that reduce our acquisition cost of those customers. Additionally, equipment costs associated with existing
customers, net of related revenues, are excluded as this measure is intended to reflect only the acquisition costs
related to new customers. The following table reconciles total costs used in the calculation of CPGA to selling
expenses, which we consider to be the most directly comparable GAAP financial measure to CPGA.
Year Ended December 31,
2005 2006 2007
(In thousands, except gross customer additions and
CPGA)
Calculation of Cost Per Gross Addition (CPGA):
Selling expenses .........................................................................................
.
$ 62,396 $ 104,620 $ 153,065
Less:
Activation revenues .................................................................................
.
(6,808) (8,297) (11,425)
Less:
Equipment revenues ................................................................................
.
(166,328) (255,916) (316,537)
Add:
Equipment revenue not associated with new customers ..........................
.
77,010 114,392 142,822
Add:
Cost of equipment....................................................................................
.
300,871 476,877 597,233
Less:
Equipment costs not associated with new customers...............................
.
(109,803) (155,930) (192,153)
Gross addition expenses..............................................................................
.
$ 157,338 $ 275,746 $ 373,005
Divided by:
Gross customer additions.........................................................................
.
1,532,071 2,345,135 3,004,177
CPGA .........................................................................................................
.
$ 102.70 $ 117.58 $ 124.16