Metro PCS 2007 Annual Report Download - page 140
Download and view the complete annual report
Please find page 140 of the 2007 Metro PCS annual report below. You can navigate through the pages in the report by either clicking on the pages listed below, or by using the keyword search tool below to find specific information within the annual report.-
 1
1 -
2
-
3
-
4
-
5
-
6
-
7
-
8
-
9
-
10
-
11
-
12
-
13
-
14
-
15
-
16
-
17
-
18
-
19
-
20
-
21
-
22
-
23
-
24
-
25
-
26
-
27
-
28
-
29
-
30
-
31
-
32
-
33
-
34
-
35
-
36
-
37
-
38
-
39
-
40
-
41
-
42
-
43
-
44
-
45
-
46
-
47
-
48
-
49
-
50
-
51
-
52
-
53
-
54
-
55
-
56
-
57
-
58
-
59
-
60
-
61
-
62
-
63
-
64
-
65
-
66
-
67
-
68
-
69
-
70
-
71
-
72
-
73
-
74
-
75
-
76
-
77
-
78
-
79
-
80
-
81
-
82
-
83
-
84
-
85
-
86
-
87
-
88
-
89
-
90
-
91
-
92
-
93
-
94
-
95
-
96
-
97
-
98
-
99
-
100
-
101
-
102
-
103
-
104
-
105
-
106
-
107
-
108
-
109
-
110
-
111
-
112
-
113
-
114
-
115
-
116
-
117
-
118
-
119
-
120
-
121
-
122
-
123
-
124
-
125
-
126
-
127
-
128
-
129
-
 130
130 -
 131
131 -
 132
132 -
 133
133 -
 134
134 -
 135
135 -
 136
136 -
 137
137 -
 138
138 -
 139
139 -
 140
140 -
 141
141 -
 142
142 -
 143
143 -
 144
144 -
 145
145 -
 146
146 -
 147
147 -
 148
148 -
 149
149 -
 150
150 -
151
-
152
-
153
-
154
-
155
-
156
-
157
-
158
-
159
-
160
 |
 |

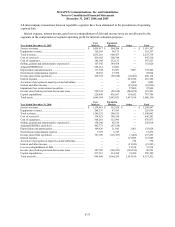
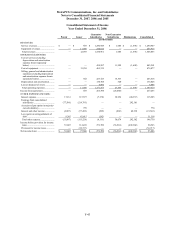
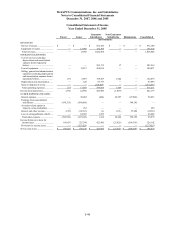
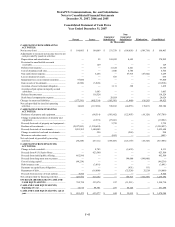
MetroPCS Communications, Inc. and Subsidiaries
Notes to Consolidated Financial Statements
December 31, 2007, 2006 and 2005
F-41
Consolidated Balance Sheet
As of December 31, 2006
Parent
Issuer
Guarantor
Subsidiaries
Non-
Guarantor
Subsidiaries
Eliminations
Consolidated
(In thousands)
CURRENT ASSETS:
Cash and cash equivalents................. $ 15,714 $ 99,301 $ 257 $ 46,226 $ — $ 161,498
Short-term investments ..................... 45,365 345,286 — — — 390,651
Restricted short-term investments..... — 556 — 51 — 607
Inventories, net .................................. — 81,339 11,576 — — 92,915
Accounts receivable, net ................... — 29,348 — 1,005 (2,213) 28,140
Prepaid charges ................................. — 8,107 23,865 1,137 — 33,109
Deferred charges ............................... — 26,509 — — — 26,509
Deferred tax asset .............................. — 815 — — — 815
Current receivable from
subsidiaries...................................... — 4,734 — — (4,734) —
Other current assets ........................... 97 9,478 15,354 120 (766) 24,283
Total current assets........................... 61,176 605,473 51,052 48,539 (7,713) 758,527
Property and equipment, net ............. — 14,077 1,158,442 83,643 — 1,256,162
Long-term investments...................... — 1,865 — — — 1,865
Investment in subsidiaries................. 320,783 939,009 — — (1,259,792) —
FCC licenses...................................... 1,391,410 — 387,876 293,599 — 2,072,885
Microwave relocation costs............... — — 9,187 — — 9,187
Long-term receivable from
subsidiaries...................................... — 456,070 — — (456,070) —
Other assets........................................ 399 51,477 4,078 5,810 (7,268) 54,496
Total assets ....................................... $ 1,773,768 $ 2,067,971 $ 1,610,635 $ 431,591 $ (1,730,843) $ 4,153,122
CURRENT LIABILITIES:
Accounts payable and accrued
expenses .......................................... $ 401 $ 138,953 $ 161,663 $ 29,614 $ (4,950) $ 325,681
Current maturities of long-term
debt.................................................. — 16,000 — 4,734 (4,734) 16,000
Deferred revenue............................... — 19,030 71,471 — — 90,501
Advances to subsidiaries ................... 865,612 (1,207,821) 341,950 — 259 —
Other current liabilities ..................... — 31 3,416 757 (757) 3,447
Total current liabilities ..................... 866,013 (1,033,807) 578,500 35,105 (10,182) 435,629
Long-term debt.................................. — 2,580,000 — 4,540 (4,540) 2,580,000
Long-term note to parent................... — — — 456,070 (456,070) —
Deferred tax liabilities....................... 7 177,190 — — — 177,197
Deferred rents.................................... — — 21,784 419 — 22,203
Redeemable minority interest ........... — 4,029 — — — 4,029
Other long-term liabilities ................. — 19,517 6,285 514 — 26,316
Total liabilities ................................. 866,020 1,746,929 606,569 496,648 (470,792) 3,245,374
COMMITMENTS AND
CONTINGENCIES (See
Note 10)
SERIES D PREFERRED STOCK ..... 443,368 — — — — 443,368
SERIES E PREFERRED STOCK ..... 51,135 — — — — 51,135
STOCKHOLDERS’ EQUITY:
Preferred stock................................... — — — — — —
Common stock................................... 16 — — — — 16
Additional paid-in capital.................. 166,315 — — 20,000 (20,000) 166,315
Retained earnings (deficit) ................ 245,690 319,863 1,004,066 (85,057) (1,238,872) 245,690
Accumulated other comprehensive
income............................................. 1,224 1,179 — — (1,179) 1,224
Total stockholders’ equity................ 413,245 321,042 1,004,066 (65,057) (1,260,051) 413,245
Total liabilities and stockholders’
equity ............................................. $ 1,773,768 $ 2,067,971 $ 1,610,635 $ 431,591 $ (1,730,843) $ 4,153,122