Metro PCS 2007 Annual Report Download - page 73
Download and view the complete annual report
Please find page 73 of the 2007 Metro PCS annual report below. You can navigate through the pages in the report by either clicking on the pages listed below, or by using the keyword search tool below to find specific information within the annual report.-
 1
1 -
2
-
3
-
4
-
5
-
6
-
7
-
8
-
9
-
10
-
11
-
12
-
13
-
14
-
15
-
16
-
17
-
18
-
19
-
20
-
21
-
22
-
23
-
24
-
25
-
26
-
27
-
28
-
29
-
30
-
31
-
32
-
33
-
34
-
35
-
36
-
37
-
38
-
39
-
40
-
41
-
42
-
43
-
44
-
45
-
46
-
47
-
48
-
49
-
50
-
51
-
52
-
53
-
54
-
55
-
56
-
57
-
58
-
59
-
60
-
61
-
62
-
 63
63 -
 64
64 -
 65
65 -
 66
66 -
 67
67 -
 68
68 -
 69
69 -
 70
70 -
 71
71 -
 72
72 -
 73
73 -
 74
74 -
 75
75 -
 76
76 -
 77
77 -
 78
78 -
 79
79 -
 80
80 -
 81
81 -
 82
82 -
 83
83 -
84
-
85
-
86
-
87
-
88
-
89
-
90
-
91
-
92
-
93
-
94
-
95
-
96
-
97
-
98
-
99
-
100
-
101
-
102
-
103
-
104
-
105
-
106
-
107
-
108
-
109
-
110
-
111
-
112
-
113
-
114
-
115
-
116
-
117
-
118
-
119
-
120
-
121
-
122
-
123
-
124
-
125
-
126
-
127
-
128
-
129
-
130
-
131
-
132
-
133
-
134
-
135
-
136
-
137
-
138
-
139
-
140
-
141
-
142
-
143
-
144
-
145
-
146
-
147
-
148
-
149
-
150
-
151
-
152
-
153
-
154
-
155
-
156
-
157
-
158
-
159
-
160
 |
 |

62
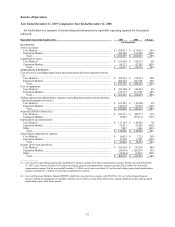
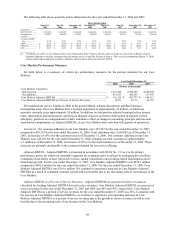
Year Ended December 31, 2006 Compared to Year Ended December 31, 2005
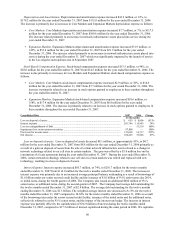
Set forth below is a summary of certain financial information by reportable operating segment for the periods
indicated:
Reportable Operating Segment Data 2006 2005 Change
(In thousands)
REVENUES:
Service revenues:
Core Markets ............................................................................................... $ 1,138,019 $ 868,681 31%
Expansion Markets ...................................................................................... 152,928 3,419 **
Total............................................................................................................ $ 1,290,947 $ 872,100 48%
Equipment revenues:
Core Markets ............................................................................................... $ 208,333 $ 163,738 27%
Expansion Markets ...................................................................................... 47,583 2,590 **
Total............................................................................................................ $ 255,916 $ 166,328 54%
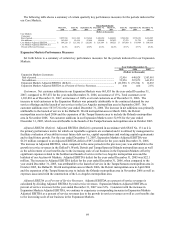
OPERATING EXPENSES:
Cost of service (excluding depreciation and amortization disclosed
separately below)(1):
Core Markets ............................................................................................... $ 338,923 $ 271,437 25%
Expansion Markets ...................................................................................... 106,358 11,775 **
Total............................................................................................................ $ 445,281 $ 283,212 57%
Cost of equipment:
Core Markets ............................................................................................... $ 364,281 $ 293,702 24%
Expansion Markets ...................................................................................... 112,596 7,169 **
Total............................................................................................................ $ 476,877 $ 300,871 59%
Selling, general and administrative expenses (excluding depreciation
and amortization disclosed separately below)(1):
Core Markets ............................................................................................... $ 158,100 $ 153,321 3%
Expansion Markets ...................................................................................... 85,518 9,155 **
Total............................................................................................................ $ 243,618 $ 162,476 50%
Adjusted EBITDA (Deficit)(2):
Core Markets ............................................................................................... $ 492,773 $ 316,555 56%
Expansion Markets ...................................................................................... (97,214) (22,090) **
Depreciation and amortization:
Core Markets ............................................................................................... $ 109,626 $ 84,436 30%
Expansion Markets ...................................................................................... 21,941 2,030 **
Other ............................................................................................................ 3,461 1,429 142%
Total............................................................................................................ $ 135,028 $ 87,895 54%
Stock-based compensation expense:
Core Markets ............................................................................................... $ 7,725 $ 2,596 198%
Expansion Markets ...................................................................................... 6,747 — **
Total............................................................................................................ $ 14,472 $ 2,596 457%
Income (loss) from operations:
Core Markets ............................................................................................... $ 367,109 $ 219,777 67%
Expansion Markets ...................................................................................... (126,387) (24,370) **
Other ............................................................................................................ (3,469) 226,770 (102)%
Total............................................................................................................ $ 237,253 $ 422,177 (44)%
__________
**Not meaningful. The Expansion Markets reportable segment had no significant operations during 2005.
(1) Cost of service and selling, general and administrative expenses include stock-based compensation expense. For the year ended
December 31, 2006, cost of service includes $1.3 million and selling, general and administrative expenses includes $13.2 million of stock-
based compensation expense.
(2) Core and Expansion Markets Adjusted EBITDA (deficit) is presented in accordance with SFAS No. 131 as it is the primary financial
measure utilized by management to facilitate evaluation of our ability to meet future debt service, capital expenditures and working capital
requirements and to fund future growth. See “Management’ s Discussion and Analysis of Financial Condition and Results of Operations —
Operating Segments.”
Service Revenues: Service revenues increased $418.8 million, or 48%, to $1,290.9 million for the year ended
December 31, 2006 from $872.1 million for the year ended December 31, 2005. The increase is due to increases in
Core Markets and Expansion Markets service revenues as follows:
• Core Markets. Core Markets service revenues increased $269.3 million, or 31%, to $1,138.0 million for the
year ended December 31, 2006 from $868.7 million for the year ended December 31, 2005. The increase in
service revenues is primarily attributable to net additions of approximately 430,000 customers accounting for
$199.2 million of the Core Markets increase, coupled with the migration of existing customers to higher price
rate plans accounting for $70.1 million of the Core Markets increase.