Metro PCS 2007 Annual Report Download - page 79
Download and view the complete annual report
Please find page 79 of the 2007 Metro PCS annual report below. You can navigate through the pages in the report by either clicking on the pages listed below, or by using the keyword search tool below to find specific information within the annual report.-
 1
1 -
2
-
3
-
4
-
5
-
6
-
7
-
8
-
9
-
10
-
11
-
12
-
13
-
14
-
15
-
16
-
17
-
18
-
19
-
20
-
21
-
22
-
23
-
24
-
25
-
26
-
27
-
28
-
29
-
30
-
31
-
32
-
33
-
34
-
35
-
36
-
37
-
38
-
39
-
40
-
41
-
42
-
43
-
44
-
45
-
46
-
47
-
48
-
49
-
50
-
51
-
52
-
53
-
54
-
55
-
56
-
57
-
58
-
59
-
60
-
61
-
62
-
63
-
64
-
65
-
66
-
67
-
68
-
 69
69 -
 70
70 -
 71
71 -
 72
72 -
 73
73 -
 74
74 -
 75
75 -
 76
76 -
 77
77 -
 78
78 -
 79
79 -
 80
80 -
 81
81 -
 82
82 -
 83
83 -
 84
84 -
 85
85 -
 86
86 -
 87
87 -
 88
88 -
 89
89 -
90
-
91
-
92
-
93
-
94
-
95
-
96
-
97
-
98
-
99
-
100
-
101
-
102
-
103
-
104
-
105
-
106
-
107
-
108
-
109
-
110
-
111
-
112
-
113
-
114
-
115
-
116
-
117
-
118
-
119
-
120
-
121
-
122
-
123
-
124
-
125
-
126
-
127
-
128
-
129
-
130
-
131
-
132
-
133
-
134
-
135
-
136
-
137
-
138
-
139
-
140
-
141
-
142
-
143
-
144
-
145
-
146
-
147
-
148
-
149
-
150
-
151
-
152
-
153
-
154
-
155
-
156
-
157
-
158
-
159
-
160
 |
 |

68
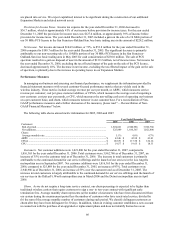
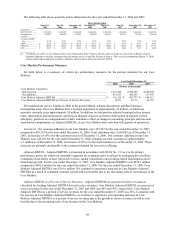
The following table shows quarterly metric information for the years ended December 31, 2006 and 2007.
Three Months Ended
March 31,
2006
June 30,
2006
September 30,
2006
December 31,
2006
March 31,
2007
June 30,
2007
September 30,
2007
December 31,
2007
Customers:..............
End of period .......... 2,170,059 2,418,909 2,616,532 2,940,986 3,395,203 3,549,916 3,664,218 3,962,786
Net additions........... 245,437 248,850 197,623 324,454 454,217 154,713 114,302 298,568
Churn(1): ................
Average monthly
rate ....................... 4.4% 4.5% 5.0% 4.5% 4.0% 4.8% 5.2% 4.8%
ARPU ..................... $ 43.12 $ 42.86 $ 42.78 $ 43.15 $ 43.75 $ 43.18 $ 42.77 $ 42.54
CPGA(1)................. $ 106.26 $ 122.20 $ 120.29 $ 120.01 $ 108.80 $ 124.79 $ 125.92 $ 137.51
CPU ........................ $ 20.11 $ 19.78 $ 19.15 $ 19.67 $ 18.56 $ 18.01 $ 17.81 $ 18.93
__________
(1) On January 23, 2006, we revised the terms of our return policy from 7 days to 30 days, and as a result we revised our definition of gross
customer additions to exclude customers that discontinue service in the first 30 days of service. This revision, commencing March 23, 2006,
reduces deactivations and gross customer additions, which reduces churn and increases CPGA.
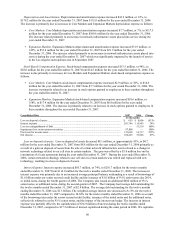
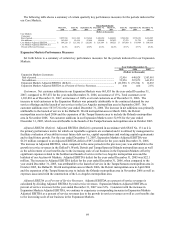
Core Markets Performance Measures
Set forth below is a summary of certain key performance measures for the periods indicated for our Core
Markets:
Year Ended December 31,
2005 2006 2007
(Dollars in thousands)
Core Markets Customers:
End of period ..........................................................................................................
.
1,871,665 2,300,958 2,658,905
Net additions...........................................................................................................
.
472,933 429,293 357,947
Core Markets Adjusted EBITDA.............................................................................
.
$ 316,555 $ 492,773 $ 654,112
Core Markets Adjusted EBITDA as a Percent of Service Revenues .......................
.
36.4% 43.3% 46.2%
We launched our service initially in 2002 in the greater Miami, Atlanta, Sacramento and San Francisco
metropolitan areas. Our Core Markets have a licensed population of approximately 26 million, of which our
networks currently cover approximately 24 million. In addition, we had positive adjusted earnings before interest,
taxes, depreciation and amortization, gain/loss on disposal of assets, accretion of put option in majority-owned
subsidiary, gain/loss on extinguishment of debt, cumulative effect of change in accounting principle and non-cash
stock-based compensation, or Adjusted EBITDA, in our Core Markets after only four full quarters of operations.
Customers. Net customer additions in our Core Markets were 357,947 for the year ended December 31, 2007,
compared to 429,293 for the year ended December 31, 2006. Total customers were 2,658,905 as of December 31,
2007, an increase of 16% over the customer total as of December 31, 2006. Net customer additions in our Core
Markets were 429,293 for the year ended December 31, 2006, bringing our total customers to approximately
2.3 million as of December 31, 2006, an increase of 23% over the total customers as of December 31, 2005. These
increases are primarily attributable to the continued demand for our service offering.
Adjusted EBITDA. Adjusted EBITDA is presented in accordance with SFAS No. 131 as it is the primary
performance metric for which our reportable segments are evaluated and it is utilized by management to facilitate
evaluation of our ability to meet future debt service, capital expenditures and working capital requirements and to
fund future growth. For the year ended December 31, 2007, Core Markets Adjusted EBITDA was $654.1 million
compared to $492.8 million for the year ended December 31, 2006. For the year ended December 31, 2005, Core
Markets Adjusted EBITDA was $316.6 million. We continue to experience increases in Core Markets Adjusted
EBITDA as a result of continued customer growth and cost benefits due to the increasing scale of our business in the
Core Markets.
Adjusted EBITDA as a Percent of Service Revenues. Adjusted EBITDA as a percent of service revenues is
calculated by dividing Adjusted EBITDA by total service revenues. Core Markets Adjusted EBITDA as a percent of
service revenues for the year ended December 31, 2007 and 2006 was 46% and 43%, respectively. Core Markets
Adjusted EBITDA as a percent of service revenues for the year ended December 31, 2005 was 36%. Consistent with
the increase in Core Markets Adjusted EBITDA, we continue to experience corresponding increases in Core
Markets Adjusted EBITDA as a percent of service revenues due to the growth in service revenues as well as cost
benefits due to the increasing scale of our business in the Core Markets.