Metro PCS 2007 Annual Report Download - page 143
Download and view the complete annual report
Please find page 143 of the 2007 Metro PCS annual report below. You can navigate through the pages in the report by either clicking on the pages listed below, or by using the keyword search tool below to find specific information within the annual report.-
 1
1 -
2
-
3
-
4
-
5
-
6
-
7
-
8
-
9
-
10
-
11
-
12
-
13
-
14
-
15
-
16
-
17
-
18
-
19
-
20
-
21
-
22
-
23
-
24
-
25
-
26
-
27
-
28
-
29
-
30
-
31
-
32
-
33
-
34
-
35
-
36
-
37
-
38
-
39
-
40
-
41
-
42
-
43
-
44
-
45
-
46
-
47
-
48
-
49
-
50
-
51
-
52
-
53
-
54
-
55
-
56
-
57
-
58
-
59
-
60
-
61
-
62
-
63
-
64
-
65
-
66
-
67
-
68
-
69
-
70
-
71
-
72
-
73
-
74
-
75
-
76
-
77
-
78
-
79
-
80
-
81
-
82
-
83
-
84
-
85
-
86
-
87
-
88
-
89
-
90
-
91
-
92
-
93
-
94
-
95
-
96
-
97
-
98
-
99
-
100
-
101
-
102
-
103
-
104
-
105
-
106
-
107
-
108
-
109
-
110
-
111
-
112
-
113
-
114
-
115
-
116
-
117
-
118
-
119
-
120
-
121
-
122
-
123
-
124
-
125
-
126
-
127
-
128
-
129
-
130
-
131
-
132
-
 133
133 -
 134
134 -
 135
135 -
 136
136 -
 137
137 -
 138
138 -
 139
139 -
 140
140 -
 141
141 -
 142
142 -
 143
143 -
 144
144 -
 145
145 -
 146
146 -
 147
147 -
 148
148 -
 149
149 -
 150
150 -
 151
151 -
 152
152 -
 153
153 -
154
-
155
-
156
-
157
-
158
-
159
-
160
 |
 |

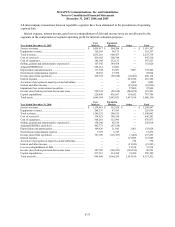
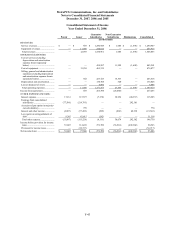
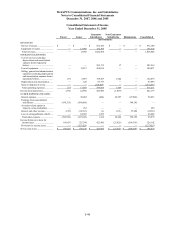
MetroPCS Communications, Inc. and Subsidiaries
Notes to Consolidated Financial Statements
December 31, 2007, 2006 and 2005
F-44
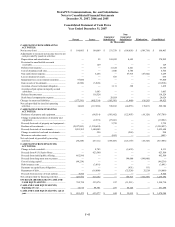
Consolidated Statement of Income
Year Ended December 31, 2005
Parent
Issuer
Guarantor
Subsidiaries
Non-Guarantor
Subsidiaries
Eliminations
Consolidated
(In thousands)
REVENUES:
Service revenues............................. $ — $ — $ 872,100 $ — $ — $ 872,100
Equipment revenues....................... — 13,960 152,368 — — 166,328
Total revenues ............................... — 13,960 1,024,468 — — 1,038,428
OPERATING EXPENSES:
Cost of service (excluding
depreciation and amortization
expense shown separately
below) .......................................... — — 283,175 37 — 283,212
Cost of equipment .......................... — 12,837 288,034 — — 300,871
Selling, general and administrative
expenses (excluding depreciation
and amortization expense shown
separately below)......................... 274 2,893 158,287 1,022 — 162,476
Depreciation and amortization....... — 120 87,775 — — 87,895
Gain on disposal of assets.............. — — (218,203) — — (218,203)
Total operating expenses............... 274 15,850 599,068 1,059 — 616,251
Income from operations .................. (274) (1,890) 425,400 (1,059) — 422,177
OTHER EXPENSE (INCOME):
Interest expense.............................. — 58,482 (444) 26,997 (27,002) 58,033
Earnings from consolidated
subsidiaries .................................. (198,335) (396,060) — — 594,395 —
Accretion of put option in
majority-owned subsidiary .......... — 252 — — — 252
Interest and other income............... (615) (34,913) (1) (131) 27,002 (8,658)
Loss on extinguishment of debt..... — 44,589 1,859 — — 46,448
Total other expense ....................... (198,950) (327,650) 1,414 26,866 594,395 96,075
Income before provision for
income taxes ................................. 198,676 325,760 423,986 (27,925) (594,395) 326,102
Provision for income taxes............. — (127,425) — — — (127,425)
Net income (loss) ............................ $ 198,676 $ 198,335 $ 423,986 $ (27,925) $ (594,395) $ 198,677