Metro PCS 2007 Annual Report Download - page 78
Download and view the complete annual report
Please find page 78 of the 2007 Metro PCS annual report below. You can navigate through the pages in the report by either clicking on the pages listed below, or by using the keyword search tool below to find specific information within the annual report.-
 1
1 -
2
-
3
-
4
-
5
-
6
-
7
-
8
-
9
-
10
-
11
-
12
-
13
-
14
-
15
-
16
-
17
-
18
-
19
-
20
-
21
-
22
-
23
-
24
-
25
-
26
-
27
-
28
-
29
-
30
-
31
-
32
-
33
-
34
-
35
-
36
-
37
-
38
-
39
-
40
-
41
-
42
-
43
-
44
-
45
-
46
-
47
-
48
-
49
-
50
-
51
-
52
-
53
-
54
-
55
-
56
-
57
-
58
-
59
-
60
-
61
-
62
-
63
-
64
-
65
-
66
-
67
-
 68
68 -
 69
69 -
 70
70 -
 71
71 -
 72
72 -
 73
73 -
 74
74 -
 75
75 -
 76
76 -
 77
77 -
 78
78 -
 79
79 -
 80
80 -
 81
81 -
 82
82 -
 83
83 -
 84
84 -
 85
85 -
 86
86 -
 87
87 -
 88
88 -
89
-
90
-
91
-
92
-
93
-
94
-
95
-
96
-
97
-
98
-
99
-
100
-
101
-
102
-
103
-
104
-
105
-
106
-
107
-
108
-
109
-
110
-
111
-
112
-
113
-
114
-
115
-
116
-
117
-
118
-
119
-
120
-
121
-
122
-
123
-
124
-
125
-
126
-
127
-
128
-
129
-
130
-
131
-
132
-
133
-
134
-
135
-
136
-
137
-
138
-
139
-
140
-
141
-
142
-
143
-
144
-
145
-
146
-
147
-
148
-
149
-
150
-
151
-
152
-
153
-
154
-
155
-
156
-
157
-
158
-
159
-
160
 |
 |
67
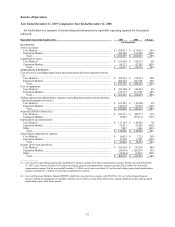
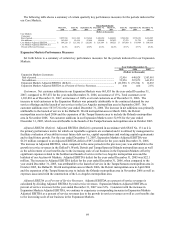
existing customer, we count the phone leaving service as a churn and the new phone entering service as a gross
customer addition. Churn for the year ended December 31, 2007 was 4.7% compared to 4.6% for the year ended
December 31, 2006. Churn increased 0.1% for the year ended December 31, 2007 over the year ended December 31,
2006 due to normal historical trends related to the maturity of our markets coupled with continued disconnects from
the significant increase in gross additions in the first quarter of 2007 compared to the first quarter of 2006. Churn
for the year ended December 31, 2006 was 4.6% compared to 5.1% for the year ended December 31, 2005. Based
upon a change in the allowable return period from 7 days to 30 days, we revised our definition of gross customer
additions to exclude customers that discontinue service in the first 30 days of service. This revision reduces
deactivations and gross customer additions commencing March 23, 2006, and reduces churn. Our customer activity
is influenced by seasonal effects related to traditional retail selling periods and other factors that arise from our
target customer base. Based on historical results, we generally expect net customer additions to be strongest in the
first and fourth quarters. Softening of sales and increased churn in the second and third quarters of the year usually
combine to result in fewer net customer additions during these quarters.
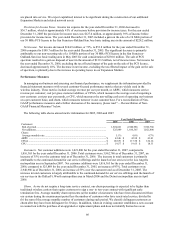
Average Revenue Per User. ARPU represents (a) service revenues less activation revenues, E-911, FUSF, and
vendor’ s compensation charges for the measurement period, divided by (b) the sum of the average monthly number
of customers during such period. ARPU was $43.03 and $42.98 for the years ended December 31, 2007 and 2006,
respectively, an increase of $0.05. ARPU increased $0.58, or approximately 1.4%, during 2006 from $42.40 for the
year ended December 31, 2005. The increase in ARPU was primarily the result of attracting customers to higher
priced service plans. At December 31, 2007, over 85% of our customers were on the $40 or higher rate plan.
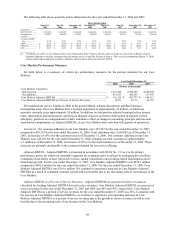
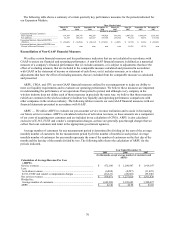
Cost Per Gross Addition. CPGA is determined by dividing (a) selling expenses plus the total cost of equipment
associated with transactions with new customers less activation revenues and equipment revenues associated with
transactions with new customers during the measurement period by (b) gross customer additions during such period.
Retail customer service expenses and equipment margin on handsets sold to existing customers when they are
identified, including handset upgrade transactions, are excluded, as these costs are incurred specifically for existing
customers. CPGA costs have increased to $124.16 for the year ended December 31, 2007 from $117.58 for the year
ended December 31, 2006, which was primarily driven by the selling expenses and equipment subsidy associated
with the customer growth in our Expansion Markets as well as selling expenses associated with the launch of service
in the Los Angles metropolitan area. CPGA costs increased to $117.58 for the year ended December 31, 2006 from
$102.70 for the year ended December 31, 2005, which was primarily driven by the selling expenses associated with
the launch of service in the Dallas/Ft. Worth metropolitan area, the Detroit metropolitan area and the expansion of
the Tampa/Sarasota area to include the Orlando metropolitan area. In addition, on January 23, 2006, we revised the
terms of our return policy from 7 days to 30 days, and as a result we revised our definition of gross customer
additions to exclude customers that discontinue service in the first 30 days of service. This revision, commencing
March 23, 2006, reduces deactivations and gross customer additions and increases CPGA.
Cost Per User. CPU is cost of service and general and administrative costs (excluding applicable non-cash stock-
based compensation expense included in cost of service and general and administrative expense) plus net loss on
handset equipment transactions unrelated to initial customer acquisition (which includes the gain or loss on sale of
handsets to existing customers and costs associated with handset replacements and repairs (other than warranty costs
which are the responsibility of the handset manufacturers)), divided by sum of the average monthly number of
customers during such period. CPU for the years ended December 31, 2007 and 2006 was $18.33 and $19.65,
respectively. CPU for the year ended December 31, 2005 was $19.57. We continue to achieve cost benefits due to
the increasing scale of our business. However, these benefits have been offset by a combination of the construction
and launch expenses associated with our Expansion Markets, which contributed approximately $3.36 and $3.42 of
additional CPU for the years ended December 31, 2007 and 2006, respectively. In addition, CPU has increased
historically due to costs associated with higher ARPU service plans such as those related to unlimited nationwide
long distance. During the year ended December 31, 2005, CPU was impacted by substantial legal and accounting
expenses in the amount of approximately $5.9 million associated with an internal investigation related to material
weaknesses in our internal control over financial reporting as well as financial statement audits related to our
restatement efforts.